
Page 196 - 2018 Comprehensive Annual Financial Report - City of Winston-Salem
P. 196
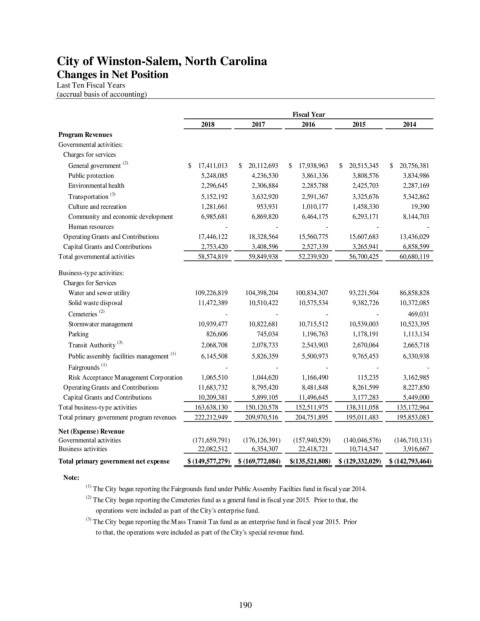
City of Winston-Salem, North Carolina
               Changes in Net Position

               Last Ten Fiscal Years
               (accrual basis of accounting)

                                                                            Fiscal Year
                                                    2018         2017         2016         2015         2014
                Program Revenues
                Governmental activities:
                 Charges for services
                  General government  (2)        $      17,411,013  $      20,112,693  $      17,938,963  $      20,515,345  $      20,756,381
                  Public protection                        5,248,085            4,236,530            3,861,336            3,808,576            3,834,986
                  Environmental health                     2,296,645            2,306,884            2,285,788            2,425,703            2,287,169
                  Transportation  (3)                      5,152,192            3,632,920            2,591,367            3,325,676            5,342,862
                  Culture and recreation                   1,281,661               953,931            1,010,177            1,458,330                 19,390
                  Community and economic development            6,985,681            6,869,820            6,464,175            6,293,171            8,144,703
                  Human resources                                         -                           -                          -                           -                           -
                 Operating Grants and Contributions          17,446,122          18,328,564          15,560,775          15,607,683          13,436,029
                 Capital Grants and Contributions            2,753,420            3,408,596            2,527,339            3,265,941            6,858,599
                Total governmental activities            58,574,819          59,849,938          52,239,920          56,700,425          60,680,119

                Business-type activities:
                 Charges for Services
                  Water and sewer utility              109,226,819        104,398,204        100,834,307          93,221,504          86,858,828
                  Solid waste disposal                   11,472,389          10,510,422          10,575,534            9,382,726          10,372,085
                  Cemeteries  (2)                                         -                           -                          -                           -               469,031
                  Stormwater management                  10,939,477          10,822,681          10,715,512          10,539,003          10,523,395
                  Parking                                     826,606               745,034            1,196,763            1,178,191            1,113,134
                  Transit Authority  (3)                   2,068,708            2,078,733            2,543,903            2,670,064            2,665,718
                  Public assembly facilities management  (1)            6,145,508            5,826,359            5,500,973            9,765,453            6,330,938
                  Fairgrounds  (1)                                        -                           -                          -                           -                           -
                  Risk Acceptance Management Corporation           1,065,510            1,044,620            1,166,490               115,235            3,162,985
                 Operating Grants and Contributions          11,683,732            8,795,420            8,481,848            8,261,599            8,227,850
                 Capital Grants and Contributions          10,209,381            5,899,105          11,496,645            3,177,283            5,449,000
                Total business-type activities         163,638,130        150,120,578        152,511,975        138,311,058        135,172,964
                Total primary government program revenues        222,212,949        209,970,516        204,751,895        195,011,483        195,853,083
                Net (Expense) Revenue
                Governmental activities               (171,659,791)       (176,126,391)      (157,940,529)       (140,046,576)       (146,710,131)
                Business activities                      22,082,512            6,354,307          22,418,721          10,714,547            3,916,667
                Total primary government net expense  $   (149,577,279)  $   (169,772,084)  $  (135,521,808)  $   (129,332,029)  $   (142,793,464)
                 Note:
                       (1)  The City began reporting the Fairgrounds fund under Public Assemby Facilties fund in fiscal year 2014.
                       (2)  The City began reporting the Cemeteries fund as a general fund in fiscal year 2015.  Prior to that, the
                             operations were included as part of the City's enterprise fund.
                       (3)  The City began reporting the Mass Transit Tax fund as an enterprise fund in fiscal year 2015.  Prior
                               to that, the operations were included as part of the City's special revenue fund.


                                                              190