
Page 198 - 2018 Comprehensive Annual Financial Report - City of Winston-Salem
P. 198
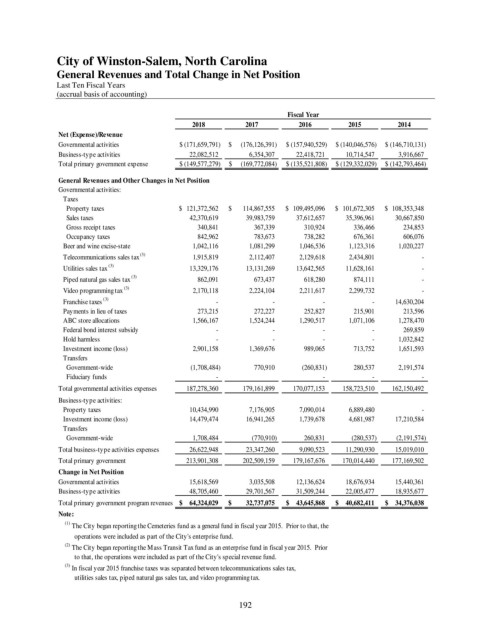
City of Winston-Salem, North Carolina
               General Revenues and Total Change in Net Position

               Last Ten Fiscal Years
               (accrual basis of accounting)

                                                                          Fiscal Year
                                                  2018          2017         2016         2015         2014
                Net (Expense)/Revenue
                Governmental activities        $   (171,659,791)  $       (176,126,391)  $   (157,940,529)  $   (140,046,576)  $   (146,710,131)
                Business-type activities               22,082,512                 6,354,307          22,418,721          10,714,547            3,916,667
                Total primary government expense  $   (149,577,279)  $       (169,772,084)  $   (135,521,808)  $   (129,332,029)  $   (142,793,464)

                General Revenues and Other Changes in Net Position
                Governmental activities:
                   Taxes
                  Property taxes               $    121,372,562  $         114,867,555  $    109,495,096  $    101,672,305  $    108,353,348
                  Sales taxes                          42,370,619       39,983,759          37,612,657          35,396,961          30,667,850
                  Gross receipt taxes                       340,841            367,339       310,924       336,466       234,853
                  Occupancy taxes                           842,962            783,673       738,282       676,361       606,076
                   Beer and wine excise-state            1,042,116         1,081,299    1,046,536    1,123,316    1,020,227
                   Telecommunications sales tax  (3)            1,915,819         2,112,407            2,129,618            2,434,801                           -
                   Utilities sales tax  (3)            13,329,176       13,131,269          13,642,565          11,628,161                           -
                   Piped natural gas sales tax  (3)               862,091            673,437               618,280               874,111                           -
                   Video programming tax  (3)            2,170,118         2,224,104            2,211,617            2,299,732                           -
                   Franchise taxes  (3)                                 -                               -                           -                           -          14,630,204
                   Payments in lieu of taxes           273,215            272,227       252,827       215,901       213,596
                   ABC store allocations            1,566,167                 1,524,244            1,290,517            1,071,106            1,278,470
                   Federal bond interest subsidy                           -                       -                   -                   -       269,859
                   Hold harmless                                        -                               -                           -                           -            1,032,842
                   Investment income (loss)         2,901,158         1,369,676       989,065       713,752    1,651,593
                   Transfers
                  Government-wide                       (1,708,484)                    770,910              (260,831)               280,537            2,191,574
                  Fiduciary funds                                       -                           -                           -                           -
                Total governmental activities expenses        187,278,360             179,161,899        170,077,153        158,723,510        162,150,492
                Business-type activities:
                   Property taxes                      10,434,990                 7,176,905            7,090,014            6,889,480                           -
                   Investment income (loss)            14,479,474               16,941,265            1,739,678            4,681,987          17,210,584
                   Transfers
                  Government-wide                        1,708,484                  (770,910)               260,831              (280,537)           (2,191,574)
                Total business-type activities expenses          26,622,948               23,347,260            9,090,523          11,290,930          15,019,010
                Total primary government             213,901,308             202,509,159        179,167,676        170,014,440        177,169,502
                Change in Net Position
                Governmental activities                15,618,569                 3,035,508          12,136,624          18,676,934          15,440,361
                Business-type activities               48,705,460               29,701,567          31,509,244          22,005,477          18,935,677
                Total primary government program revenues $      64,324,029  $           32,737,075  $      43,645,868  $      40,682,411  $      34,376,038
                Note:
                 (1)
                    The City began reporting the Cemeteries fund as a general fund in fiscal year 2015.  Prior to that, the
                       operations were included as part of the City's enterprise fund.
                 (2)  The City began reporting the Mass Transit Tax fund as an enterprise fund in fiscal year 2015.  Prior
                          to that, the operations were included as part of the City's special revenue fund.
                 (3)  In fiscal year 2015 franchise taxes was separated between telecommunications sales tax,
                          utilities sales tax, piped natural gas sales tax, and video programming tax.


                                                              192