
Page 195 - 2018 Comprehensive Annual Financial Report - City of Winston-Salem
P. 195
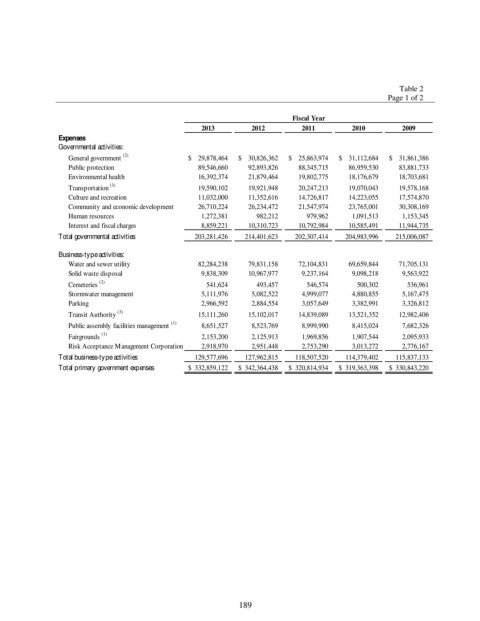
Table 2
                                                                                                    Page 1 of 2

                                                                            Fiscal Year
                                                    2013         2012         2011         2010         2009
                Expenses
                Governmental activities:
                  General government  (2)        $      29,878,464  $      30,826,362  $      25,863,974  $      31,112,684  $      31,861,386
                  Public protection                      89,546,660          92,893,826          88,345,715          86,959,530          83,881,733
                  Environmental health                   16,392,374          21,879,464          19,802,775          18,176,679          18,703,681
                  Transportation  (3)                    19,590,102          19,921,948          20,247,213          19,070,043          19,578,168
                  Culture and recreation                 11,032,000          11,352,616          14,726,817          14,223,055          17,574,870
                  Community and economic development          26,710,224          26,234,472          21,547,974          23,765,001          30,308,169
                  Human resources                          1,272,381               982,212               979,962            1,091,513            1,153,345
                  Interest and fiscal charges              8,859,221          10,310,723          10,792,984          10,585,491          11,944,735
                Total governmental activities          203,281,426        214,401,623        202,307,414        204,983,996        215,006,087

                Business-type activities:
                  Water and sewer utility                82,284,238          79,831,158          72,104,831          69,659,844          71,705,131
                  Solid waste disposal                     9,838,309          10,967,977            9,237,164            9,098,218            9,563,922
                  Cemeteries  (2)                             541,624               493,457               546,574               500,302               536,961
                  Stormwater management                    5,111,976            5,082,522            4,999,077            4,880,855            5,167,475
                  Parking                                  2,966,592            2,884,554            3,057,649            3,382,991            3,326,812
                  Transit Authority  (3)                 15,111,260          15,102,017          14,839,089          13,521,352          12,982,406
                  Public assembly facilities management  (1)            8,651,527            8,523,769            8,999,990            8,415,024            7,682,326
                  Fairgrounds  (1)                         2,153,200            2,125,913            1,969,856            1,907,544            2,095,933
                  Risk Acceptance Management Corporation           2,918,970            2,951,448            2,753,290            3,013,272            2,776,167
                Total business-type activities         129,577,696        127,962,815        118,507,520        114,379,402        115,837,133
                Total primary government expenses  $    332,859,122  $    342,364,438  $    320,814,934  $    319,363,398  $    330,843,220


                                                              189