
Page 199 - 2018 Comprehensive Annual Financial Report - City of Winston-Salem
P. 199
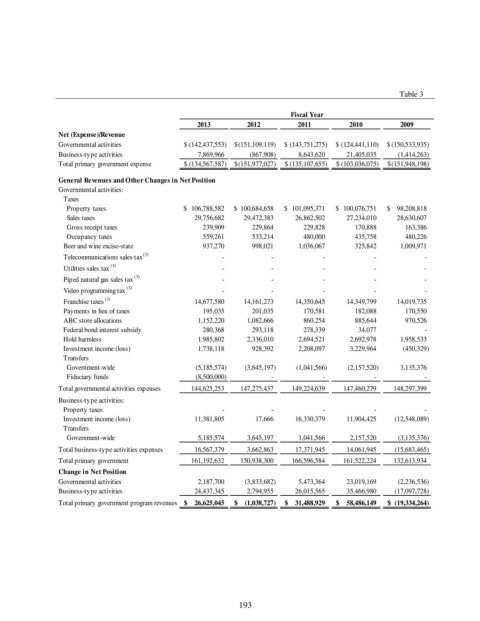
Table 3

                                                                           Fiscal Year
                                                   2013         2012         2011         2010         2009
                Net (Expense)/Revenue
                Governmental activities         $   (142,437,553)  $  (151,109,119)  $   (143,751,275)  $   (124,441,110)  $  (150,533,935)
                Business-type activities                  7,869,966             (867,908)            8,643,620          21,405,035          (1,414,263)
                Total primary government expense  $   (134,567,587)  $  (151,977,027)  $   (135,107,655)  $   (103,036,075)  $  (151,948,198)

                General Revenues and Other Changes in Net Position
                Governmental activities:
                   Taxes
                   Property taxes               $    106,788,582  $    100,684,658  $    101,095,371  $    100,076,751  $      98,208,818
                   Sales taxes                          29,756,682          29,472,383          26,862,502          27,234,010          28,630,607
                   Gross receipt taxes                  239,909       229,864       229,828       170,888       163,386
                   Occupancy taxes                      559,261       533,214       480,000       435,758       480,226
                   Beer and wine excise-state           937,270       998,021    1,036,067               325,842            1,009,971
                   Telecommunications sales tax  (3)                           -                          -                           -                           -                          -
                   Utilities sales tax  (3)                              -                          -                           -                           -                          -
                   Piped natural gas sales tax  (3)                           -                          -                           -                           -                          -
                   Video programming tax  (3)                            -                          -                           -                           -                          -
                   Franchise taxes  (3)                 14,677,580          14,161,273          14,350,645          14,349,799          14,019,735
                   Payments in lieu of taxes            195,035       201,035       170,581       182,088       170,550
                   ABC store allocations                  1,152,220            1,082,666       860,254       885,644       970,526
                   Federal bond interest subsidy        280,368       293,118       278,339         34,077   -
                   Hold harmless                          1,985,802            2,336,010    2,694,521            2,692,978            1,958,533
                   Investment income (loss)          1,738,118       928,392    2,208,097    3,229,964     (450,329)
                   Transfers
                   Government-wide                       (5,185,574)          (3,645,197)           (1,041,566)           (2,157,520)            3,135,376
                   Fiduciary funds                 (8,500,000)                          -                           -  -  -
                Total governmental activities expenses        144,625,253        147,275,437        149,224,639        147,460,279        148,297,399
                Business-type activities:
                   Property taxes                                        -                          -                           -                           -                          -
                   Investment income (loss)             11,381,805                 17,666          16,330,379          11,904,425        (12,548,089)
                   Transfers
                   Government-wide                        5,185,574            3,645,197            1,041,566            2,157,520          (3,135,376)
                Total business-type activities expenses          16,567,379            3,662,863          17,371,945          14,061,945        (15,683,465)
                Total primary government              161,192,632        150,938,300        166,596,584        161,522,224        132,613,934
                Change in Net Position
                Governmental activities                   2,187,700          (3,833,682)            5,473,364          23,019,169          (2,236,536)
                Business-type activities                24,437,345            2,794,955          26,015,565          35,466,980        (17,097,728)
                Total primary government program revenues $      26,625,045  $      (1,038,727)  $      31,488,929  $      58,486,149  $    (19,334,264)


                                                              193