
Page 205 - 2018 Comprehensive Annual Financial Report - City of Winston-Salem
P. 205
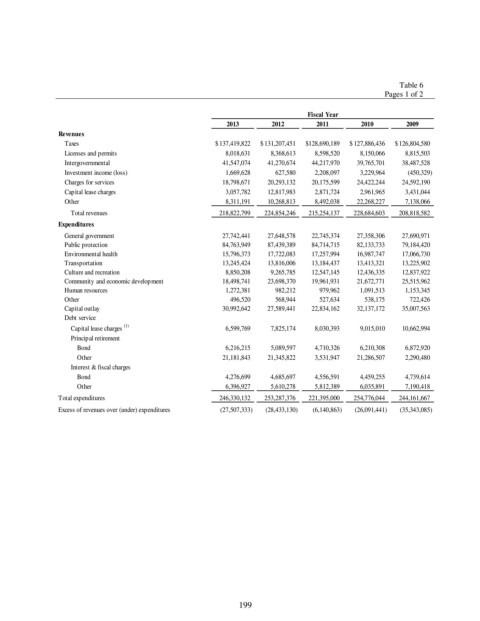
Table 6
                                                                                                   Pages 1 of 2

                                                                               Fiscal Year
                                                           2013       2012        2011       2010        2009
                Revenues
                 Taxes                                  $  137,419,822  $  131,207,451  $  128,690,189  $  127,886,436  $  126,804,580
                 Licenses and permits                           8,018,631          8,368,613          8,598,520          8,150,066          8,815,503
                 Intergovernmental                            41,547,074        41,270,674        44,217,970        39,765,701        38,487,528
                 Investment income (loss)                       1,669,628             627,580          2,208,097          3,229,964            (450,329)
                 Charges for services                         18,798,671        20,293,132        20,175,599        24,422,244        24,592,190
                 Capital lease charges                          3,057,782        12,817,983          2,871,724          2,961,965          3,431,044
                 Other                                          8,311,191        10,268,813          8,492,038        22,268,227          7,138,066
                   Total revenues                           218,822,799      224,854,246      215,254,137      228,684,603      208,818,582
                Expenditures
                 General government                           27,742,441        27,648,578        22,745,374        27,358,306        27,690,971
                 Public protection                            84,763,949        87,439,389        84,714,715        82,133,733        79,184,420
                 Environmental health                         15,796,373        17,722,083        17,257,994        16,987,747        17,066,730
                 Transportation                               13,245,424        13,816,006        13,184,437        13,413,321        13,225,902
                 Culture and recreation                         8,850,208          9,265,785        12,547,145        12,436,335        12,837,922
                 Community and economic development           18,498,741        23,698,370        19,961,931        21,672,771        25,515,962
                 Human resources                                1,272,381             982,212             979,962          1,091,513          1,153,345
                 Other                                             496,520             568,944             527,634             538,175             722,426
                 Capital outlay                               30,992,642        27,589,441        22,834,162        32,137,172        35,007,563
                 Debt service
                   Capital lease charges  (1)                   6,599,769          7,825,174          8,030,393          9,015,010        10,662,994
                   Principal retirement
                     Bond                                       6,216,215          5,089,597          4,710,326          6,210,308          6,872,920
                     Other                                    21,181,843        21,345,822          3,531,947        21,286,507          2,290,480
                   Interest & fiscal charges
                     Bond                                       4,276,699          4,685,697          4,556,591          4,459,255          4,739,614
                     Other                                      6,396,927          5,610,278          5,812,389          6,035,891          7,190,418
                Total expenditures                          246,330,132      253,287,376      221,395,000      254,776,044      244,161,667
                Excess of revenues over (under) expenditures       (27,507,333)       (28,433,130)        (6,140,863)       (26,091,441)       (35,343,085)


                                                              199