
Page 207 - 2018 Comprehensive Annual Financial Report - City of Winston-Salem
P. 207
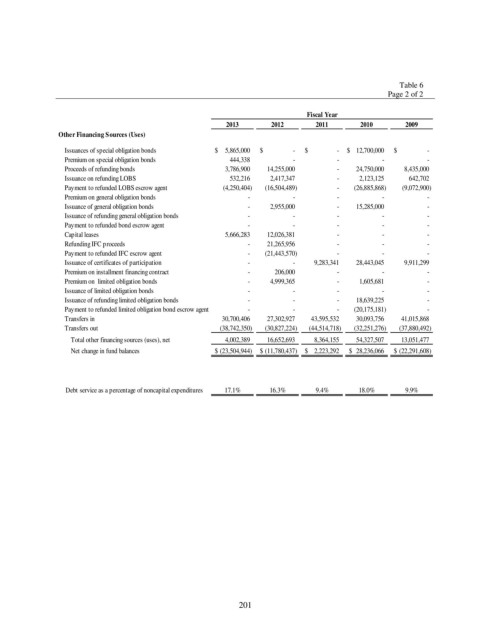
Table 6
                                                                                                    Page 2 of 2

                                                                               Fiscal Year
                                                           2013       2012        2011       2010       2009
                Other Financing Sources (Uses)
                 Issuances of special obligation bonds  $      5,865,000  $                     -  $                    -  $      12,700,000  $                     -
                 Premium on special obligation bonds               444,338                         -                        -                         -                         -
                 Proceeds of refunding bonds                    3,786,900        14,255,000                        -  24,750,000  8,435,000
                 Issuance on refunding LOBS                        532,216          2,417,347                        -  2,123,125  642,702
                 Payment to refunded LOBS escrow agent         (4,250,404)       (16,504,489)                        -  (26,885,868)  (9,072,900)
                 Premium on general obligation bonds                           -                         -                        -                         -                         -
                 Issuance of general obligation bonds                          -          2,955,000                        -        15,285,000                         -
                 Issuance of refunding general obligation bonds                         -                         -                        -                         -                         -
                 Payment to refunded bond escrow agent                         -                         -                        -                         -                         -
                 Capital leases                                 5,666,283        12,026,381                        -                         -                         -
                 Refunding IFC proceeds                                        -        21,265,956                        -                         -                         -
                 Payment to refunded IFC escrow agent                          -       (21,443,570)                        -                         -                         -
                 Issuance of certificates of participation                         -                         -          9,283,341        28,443,045          9,911,299
                 Premium on installment financing contract                         -             206,000                        -                         -                         -
                 Premium on  limited obligation bonds                          -          4,999,365                        -          1,605,681                         -
                 Issuance of limited obligation bonds                          -                         -                        -                         -                         -
                 Issuance of refunding limited obligation bonds                         -                         -                        -        18,639,225                         -
                 Payment to refunded limited obligation bond escrow agent                        -                         -                        -       (20,175,181)                         -
                 Transfers in                                 30,700,406        27,302,927        43,595,532        30,093,756        41,015,868
                 Transfers out                               (38,742,350)       (30,827,224)      (44,514,718)       (32,251,276)       (37,880,492)
                   Total other financing sources (uses), net          4,002,389        16,652,693          8,364,155        54,327,507        13,051,477
                   Net change in fund balances          $   (23,504,944)  $   (11,780,437)  $      2,223,292  $    28,236,066  $   (22,291,608)


                  Debt service as a percentage of noncapital expenditures  17.1%  16.3%  9.4%  18.0%    9.9%


                                                              201