
Page 141 - Physics Form 5 KSSM_Neat
P. 141
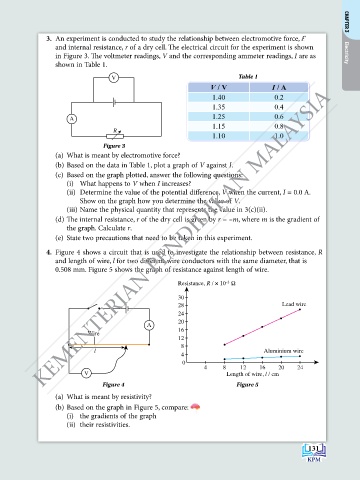
3.  An experiment is conducted to study the relationship between electromotive force, Ԑ  CHAPTER 3
                  and internal resistance, r of a dry cell. The electrical circuit for the experiment is shown
                  in Figure 3. The voltmeter readings, V and the corresponding ammeter readings, I are as   Electricity
                  shown in Table 1.

                                   V                                     Table 1
                                                                V / V              I / A
               KEMENTERIAN PENDIDIKAN MALAYSIA
                                                                 1.40              0.2
                                                                 1.35              0.4
                                                                 1.25              0.6
                      A
                                                                 1.15              0.8
                                   R
                                                                 1.10              1.0
                                Figure 3
                  (a)  What is meant by electromotive force?
                  (b) Based on the data in Table 1, plot a graph of V against I.
                  (c)  Based on the graph plotted, answer the following questions:
                     (i)  What happens to V when I increases?
                     (ii)  Determine the value of the potential difference, V when the current, I = 0.0 A.
                         Show on the graph how you determine the value of V.
                     (iii) Name the physical quantity that represents the value in 3(c)(ii).
                  (d) The internal resistance, r of the dry cell is given by r = –m, where m is the gradient of
                     the graph. Calculate r.
                  (e)  State two precautions that need to be taken in this experiment.
                4.  Figure 4 shows a circuit that is used to investigate the relationship between resistance, R
                  and length of wire, l for two different wire conductors with the same diameter, that is
                  0.508 mm. Figure 5 shows the graph of resistance against length of wire.

                                                      Resistance, R / × 10  Ω
                                                                     –2
                                                      30
                                                      28                              Lead wire
                                                      24
                                                      20
                                             A
                                                      16
                           Wire
                                                      12
                                                       8
                             l                                                  Aluminium wire
                                                       4
                                                        0
                                                              4     8    12    16    20   24
                          V                                          Length of wire, l / cm

                                Figure 4                                Figure 5
                  (a)  What is meant by resistivity?
                  (b) Based on the graph in Figure 5, compare:
                     (i)  the gradients of the graph
                     (ii)  their resistivities.


                                                                                              131