Page 249 - Physics Form 5 KSSM_Neat
P. 249

2
          1
                                                    3

             Work Function and Threshold Frequency for Photoelectric Effect                              CHAPTER 7
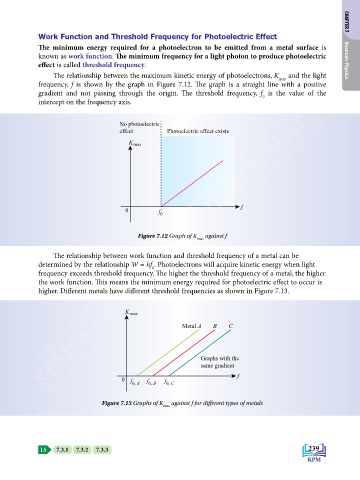
             The minimum energy required for a photoelectron to be emitted from a metal surface is
             known as work function. The minimum frequency for a light photon to produce photoelectric
             effect is called threshold frequency.                                                       Quantum Physics

          1      The relationship between the maximum kinetic energy of photoelectrons, K max  and the light
                                                    2
             frequency,  f is shown by the graph in Figure 7.12. The graph is a straight line with a positive
              KEMENTERIAN PENDIDIKAN MALAYSIA
             gradient and not passing through the origin. The threshold frequency,  f  is the value of the
                                                                                0
             intercept on the frequency axis.
                                                    3
                                     No photoelectric
                                     effect        Photoelectric effect exists
                                        K max


                                                                         f
                                       0         f 0


                                          Figure 7.12 Graph of K   against f
                                                            max
                 The relationship between work function and threshold frequency of a metal can be
             determined by the relationship W = hf . Photoelectrons will acquire kinetic energy when light
                                               0
             frequency exceeds threshold frequency. The higher the threshold frequency of a metal, the higher
             the work function. This means the minimum energy required for photoelectric effect to occur is
             higher. Different metals have different threshold frequencies as shown in Figure 7.13.


                                       K max
                                                        Metal A        B        C


                                                             Graphs with the
                                                             same gradient
                                                                        f
                                      0 f    f    f
                                         0, A  0, B  0, C

                                Figure 7.13 Graphs of K   against f for different types of metals
                                                  max


             LS   7.3.1  7.3.2  7.3.3                                                         239
   244   245   246   247   248   249   250   251   252   253   254