
Page 251 - Critical Care Nursing Demystified
P. 251
236 CRITICAL CARE NURSING DeMYSTIFIED
IV bag
3-way
stopcock
Transducer
Catheter
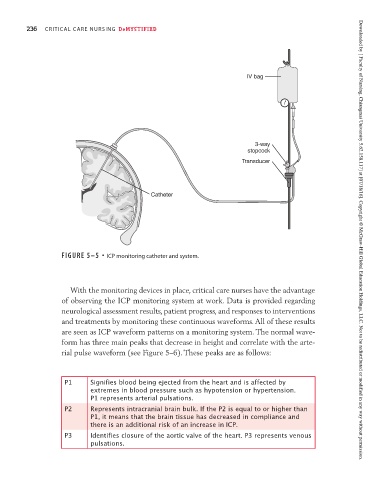
FIGURE 5–5 • ICP monitoring catheter and system. Downloaded by [ Faculty of Nursing, Chiangmai University 5.62.158.117] at [07/18/16]. Copyright © McGraw-Hill Global Education Holdings, LLC. Not to be redistributed or modified in any way without permission.
With the monitoring devices in place, critical care nurses have the advantage
of observing the ICP monitoring system at work. Data is provided regarding
neurological assessment results, patient progress, and responses to interventions
and treatments by monitoring these continuous waveforms. All of these results
are seen as ICP waveform patterns on a monitoring system. The normal wave-
form has three main peaks that decrease in height and correlate with the arte-
rial pulse waveform (see Figure 5–6). These peaks are as follows:
P1 Signifies blood being ejected from the heart and is affected by
extremes in blood pressure such as hypotension or hypertension.
P1 represents arterial pulsations.
P2 Represents intracranial brain bulk. If the P2 is equal to or higher than
P1, it means that the brain tissue has decreased in compliance and
there is an additional risk of an increase in ICP.
P3 Identifies closure of the aortic valve of the heart. P3 represents venous
pulsations.