
Page 210 - Color_Atlas_of_Physiology_5th_Ed._-_A._Despopoulos_2003
P. 210
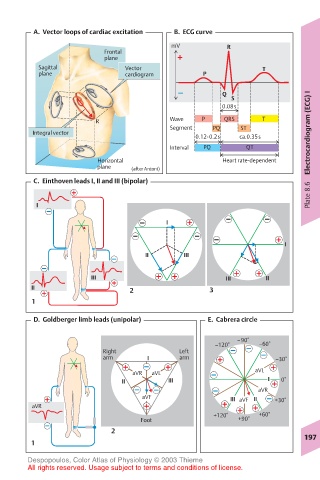
A.  Vector loops of cardiac excitation  B.  ECG curve
                                        mV          R
                        Frontal
                        plane
          Sagittal           Vector                         T
          plane              cardiogram        P

                                                   Q                   I
                                                     S
                                                   0.08s
                       R               Wave   P    QRS      T
                                       Segment   PQ    ST
        Integral vector
                                             0.12-0.2s  ca.0.35s       Electrocardiogram (ECG)
                                       Interval  PQ     QT
                       Horizontal                  Heart rate-dependent
                       plane   (after Antoni)
         C.  Einthoven leads I, II and III (bipolar)
                                                                       Plate 8.6
         I

                                      I

                                                                 I
                                  II      III

                      III                           III      II
        II                    2                 3
        1
         D.  Goldberger limb leads (unipolar)   E.  Cabrera circle

                                                      –90°
                                                 –120°     –60°
                        Right            Left
                        arm       I      arm                   –30°
                                                          aVL
                               aVR  aVL
                            II         III                   I  0°
                                                           aVR
                                 aVF                 III aVF  II  +30°
        aVR
                                                 +120°     +60°
                                 Foot                  +90°
                          2
                                                                     197
        1
       Despopoulos, Color Atlas of Physiology © 2003 Thieme
       All rights reserved. Usage subject to terms and conditions of license.