
Page 393 - Hall et al (2015) Principles of Critical Care-McGraw-Hill
P. 393
CHAPTER 34: Judging the Adequacy of Fluid Resuscitation 263
(ARDS) or sepsis. 13-15 For example, in a large European observational boost the circulation. As discussed below, however, these measures have
cohort, positive fluid balance was among the strongest predictors of death, almost no ability to distinguish fluid responders from nonresponders.
even after correcting for severity of illness. The Vasopressin in Septic In contrast, dynamic indices such as SVV are quite accurate, having
16
Shock Trial (VASST) showed that positive fluid balance correlated with a much higher positive and negative predictive values.
higher risk of dying. 17
Similar results have been shown in patients with acute renal failure. ■ STATIC MEASURES TO PREDICT FLUID RESPONSIVENESS
18
In a study of monitoring techniques in critically ill patients a secondary
logistic regression analysis identified positive fluid balance as a signifi- CVP or Right Atrial Pressure: CVP is probably the most used parameter
cant predictor of mortality (OR 1.0002 for each mL/day; p = 0.0073). for judging whether fluids should be given. Nevertheless, a large number
19
Similar results were seen in a prospective trial of goal-directed fluid of studies show that CVP fails to discriminate responders from nonre-
therapy in patients undergoing major colorectal surgery. Those ran- sponders. 29,39-41 Following the EGDT trial and publication of the original
20
domized to goal-directed treatment got significantly more fluid but did Surviving Sepsis Campaign guidelines (which proposed a CVP target
not have better outcomes. In fact, in aerobically fit subjects, outcomes of greater than 8 mm Hg for nonventilated patients and greater than or
42
were inferior. Positive fluid balance may also impede liberation from equal to 12 mm Hg for ventilated patients ) a group of French investiga-
mechanical ventilation in general critically ill patients. In a study of tors examined the role of cardiac filling pressures as predictors of fluid
28
87 ventilated subjects, both cumulative and short-term positive fluid responsiveness in 96 ventilated, septic subjects. Overall, the predictive
balance were associated with failure of a spontaneous breathing trial. power of the CVP was poor: When CVP was less than 12, the positive
21
Negative fluid balance was as predictive of weaning outcomes as the predictive value was only 47%. Even when CVP was much lower in these
rapid shallow breathing index. This association has also been noted in ventilated patients (less than 5 mm Hg), the positive predictive value was
critically ill surgical patients. Lastly, restrictive fluid strategies may still only 47%. These results should not be surprising. Raising CVP can
22
reduce length of stay following major surgery. 23 only augment perfusion when cardiac function is not limited, as can be
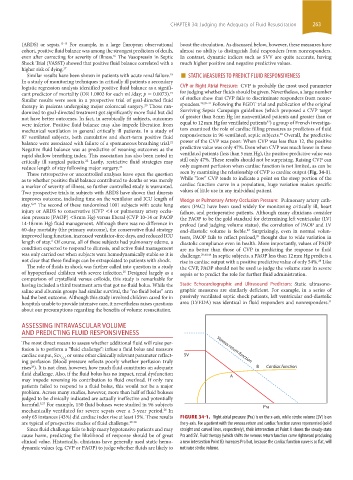
These retrospective or uncontrolled analyses leave open the question seen by examining the relationship of CVP to cardiac output (Fig. 34-1).
as to whether positive fluid balance contributed to deaths or was merely While “low” CVP tends to indicate a point on the steep portion of the
a marker of severity of illness, so further controlled study is warranted. cardiac function curve in a population, huge variation makes specific
Two prospective trials in subjects with ARDS have shown that diuresis values of little use in any individual patient.
improves outcome, including time on the ventilator and ICU length of Wedge or Pulmonary Artery Occlusion Pressure: Pulmonary artery cath-
stay. The second of these randomized 1001 subjects with acute lung eters (PAC) have been used widely for monitoring critically ill, heart
6,24
injury or ARDS to conservative (CVP <4 or pulmonary artery occlu- failure, and perioperative patients. Although many clinicians consider
sion pressure [PAOP] <8 mm Hg) versus liberal (CVP 10-14 or PAOP the PAOP to be the gold standard for determining left ventricular (LV)
14-18 mm Hg) fluid management. Although there was no difference in preload (and judging volume status), the correlation of PAOP and LV
60-day mortality (the primary outcome), the conservative fluid strategy end-diastolic volume is feeble. Surprisingly, even in normal volun-
43
improved lung function, increased ventilator-free days, and reduced ICU teers, PAOP fails to reflect preload, thought due to wide variation in
39
length of stay. Of course, all of these subjects had pulmonary edema, a diastolic compliance even in health. More importantly, values of PAOP
6
condition expected to respond to diuresis, and active fluid management are no better than those of CVP in predicting the response to fluid
was only carried out when subjects were hemodynamically stable so it is challenge. 29,40,44 In septic subjects, a PAOP less than 12 mm Hg predicts a
not clear that these findings can be extrapolated to patients with shock. rise in cardiac output with a positive predictive value of only 54%. Like
28
The role of fluids in shock was further called into question in a study the CVP, PAOP should not be used to judge the volume state in severe
of hypoperfused children with severe infection. Designed largely as a sepsis or to predict the role for further fluid administration.
25
comparison of crystalloid versus colloids, this study is remarkable for
having included a third treatment arm that got no fluid bolus. While the Static Echocardiographic and Ultrasound Predictors: Static ultrasono-
saline and albumin groups had similar survival, the “no fluid bolus” arm graphic measures are similarly deficient. For example, in a series of
had the best outcome. Although this study involved children cared for in passively ventilated septic shock patients, left ventricular end-diastolic
31
hospitals unable to provide intensive care, it nevertheless raises questions area (LVEDA) was identical in fluid responders and nonresponders.
about our presumptions regarding the benefits of volume resuscitation.
ASSESSING INTRAVASCULAR VOLUME
AND PREDICTING FLUID RESPONSIVENESS
The most direct means to assess whether additional fluid will raise per-
fusion is to perform a “fluid challenge”: infuse a fluid bolus and measure Venous return function
cardiac output, Scv , or some other clinically relevant parameter reflect- SV
O 2
ing perfusion (blood pressure reflects poorly whether perfusion truly
rises ). It is not clear, however, how much fluid constitutes an adequate B Cardiac function
26
fluid challenge. Also, if the fluid bolus has no impact, renal dysfunction A
may impede reversing its contribution to fluid overload. If only rare
patients failed to respond to a fluid bolus, this would not be a major
problem. Across many studies, however, more than half of fluid boluses
judged to be clinically indicated are actually ineffective and potentially
harmful. For example, 150 fluid boluses were studied in 96 subjects Pra
5,27
mechanically ventilated for severe sepsis over a 3-year period. In
28
only 65 instances (43%) did cardiac index rise at least 15%. These results FIGURE 34-1. Right atrial pressure (Pra) is on the x-axis, while stroke volume (SV) is on
are typical of prospective studies of fluid challenge. 29-38 the y-axis. For a patient with the venous return and cardiac function curves represented (solid
Since fluid challenge fails to help many hypotensive patients and may straight and curved lines, respectively), their intersection at Point A shows the steady-state
cause harm, predicting the likelihood of response should be of great Pra and SV. Fluid therapy (which shifts the venous return function curve rightward producing
clinical value. Historically, clinicians have generally used static hemo- a new intersection Point B) increases Pra but, because the cardiac function curve is so flat, will
dynamic values (eg, CVP or PAOP) to judge whether fluids are likely to not raise stroke volume.
section03.indd 263 1/23/2015 2:06:58 PM