
Page 398 - Hall et al (2015) Principles of Critical Care-McGraw-Hill
P. 398
268 PART 3: Cardiovascular Disorders
transthoracic echocardiographic examinations is that critically ill patients A 12
frequently are difficult to optimally position, are often on positive-
pressure mechanical ventilation, and have lung disease so lung shadows 10
obscure echocardiographic views, thus making accurate examination
difficult. Transesophageal echocardiographic examination circumvents 8
this problem and is therefore an important tool for evaluating ventricular
pump function in critically ill patients. 9,10 Cardiac output 6
■ CENTRAL VENOUS AND RIGHT HEART CATHETERS 4
During severe ventricular dysfunction or during critical illness where
even mild ventricular dysfunction contributes significantly to severity 2
of illness, more accurate measures of ventricular function than can be
determined by clinical examination alone are required. Important tools 0
in the intensive care unit (ICU) that allow for frequent serial measure- –5 0 5 10 15 20
ment to test and titrate therapy are central venous catheterization, End-diastolic pressure
pulmonary artery catheterization, or the use of related devices using
indicator dilution, pulse pressure assessment, and Doppler ultrasound
pri nciples. Serial echocardiographic assessment is sometimes also B 12
11
feasible. Central venous catheterization with the catheter tip near the
right atrium allows measurement of right ventricular filling pressure 10
(CVP) and central venous oxygen saturation, which can be used to assess
the adequacy of whole body oxygen delivery and estimate cardiac output 8
by using the Fick equation. Pulmonary artery catheterization can
12
assess cardiac output by using the thermodilution technique and 6
can measure CVP, pulmonary artery pressure (Ppa), and pulmonary artery Venous return
wedge pressure (Ppw) (with important limitations discussed in Chap. 28), 4
providing a more comprehensive physiologic evaluation. Uncritical use
of a pulmonary artery catheter may be associated with no benefit or even 2 Mean systemic
increased mortality. 13,14 Nonetheless, thoughtful use of a pulmonary artery pressure
catheter in the most severely ill may decrease mortality rate. 15 0
–5 0 5 10 15 20
IS DECREASED CARDIAC OUTPUT DUE TO CARDIAC End-diastolic pressure
DYSFUNCTION OR DECREASED VENOUS RETURN?
Cardiac output is primarily controlled by regulation of venous return—
the rate at which blood flows back to the heart. Normally, the heart C 12
simply pumps out all of the blood that returns to it, responding to
changes in venous return by using the Frank-Starling principle—that is, 10
more filling yields more ejection. Only when cardiac pump function is
greatly impaired does the heart become the limiting component in the 8
generation of cardiac output. These principles are illuminated by consid-
ering the coupling of cardiac pump function to venous return. Cardiac output 6
■ DEFINITION OF CARDIAC PUMP FUNCTION 4
AND ITS RELATION TO VENOUS RETURN 2
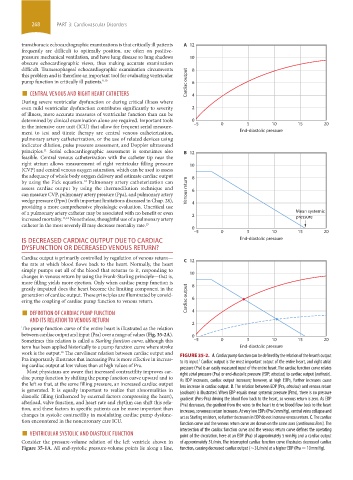
The pump function curve of the entire heart is illustrated as the relation
between cardiac output and input (Pra) over a range of values (Fig. 35-2A). 0
Sometimes this relation is called a Starling function curve, although this –5 0 5 10 15 20
term has been applied historically to a pump function curve where stroke End-diastolic pressure
work is the output. The curvilinear relation between cardiac output and FIGURE 35-2. A. Cardiac pump function can be defined by the relation of the heart’s output
16
Pra importantly illustrates that increasing Pra is more effective in increas- to its input. Cardiac output is the most important output of the entire heart, and right atrial
1
ing cardiac output at low values than at high values of Pra. pressure (Pra) is an easily measured input of the entire heart. The cardiac function curve relates
Most physicians are aware that increased contractility improves car-
diac pump function by shifting the pump function curve upward and to right atrial pressure (Pra) or end-diastolic pressure (EDP; abscissa) to cardiac output (ordinate).
As EDP increases, cardiac output increases; however, at high EDPs, further increases cause
the left so that, at the same filling pressure, an increased cardiac output less increase in cardiac output. B. The relation between EDP (Pra, abscissa) and venous return
is generated. It is equally important to realize that abnormalities in (ordinate) is illustrated. When EDP equals mean systemic pressure (Pms), there is no pressure
diastolic filling (influenced by external factors compressing the heart), gradient (Pms-Pra) driving the blood flow back to the heart, so venous return is zero. As EDP
afterload, valve function, and heart rate and rhythm can shift this rela- (Pra) decreases, the gradient from the veins to the heart to drive blood flow back to the heart
tion, and these factors in specific patients can be more important than increases, so venous return increases. At very low EDPs (Pra 0 mm Hg), central veins collapse and
changes in systolic contractility in modulating cardiac pump dysfunc- act as Starling resistors, so further decreases in EDP do not increase venous return. C. The cardiac
tion encountered in the noncoronary care ICU. function curve and the venous return curve are drawn on the same axes (continuous lines). The
■ VENTRICULAR SYSTOLIC AND DIASTOLIC FUNCTION intersection of the cardiac function curve and the venous return curve defines the operating
Consider the pressure-volume relation of the left ventricle shown in point of the circulation, here at an EDP (Pra) of approximately 5 mm Hg and a cardiac output
of approximately 5 L/min. The interrupted cardiac function curve illustrates decreased cardiac
Figure 35-1A. All end-systolic pressure-volume points lie along a line, function, causing decreased cardiac output (∼3 L/min) at a higher EDP (Pra = 10 mm Hg).
section03.indd 268 1/23/2015 2:07:02 PM