
Page 394 - Hall et al (2015) Principles of Critical Care-McGraw-Hill
P. 394
264 PART 3: Cardiovascular Disorders
Most other studies have also reported that LVEDA, as well as the ratio the forms of pulse contour analysis of the arterial blood pressure
of pulsed Doppler transmitral flow in early diastole to the early dia- tracing, is used to assess the impact 1 minute following PLR. The
50
stolic mitral annular velocity, is unable to distinguish responders and arterial pulse pressure variation (PPV) can also serve to judge the
nonresponders. 45,46 effect, but this may not be as accurate as stroke volume measures.
51
The LV ejection time fails similarly in separating responders from One study that included 71 ventilated subjects, some actively breath-
nonresponders. Right ventricular (RV) end-diastolic volume has not ing and some passive, showed that a PLR increase of aortic blood
47
been shown effective in identifying fluid responsiveness. 48 flow ≥10% signaled a response to fluids (sensitivity 97%; specific-
The inferior vena cava (IVC) is easily imaged in a subxiphoid, long- ity 94%). Multiple other studies have confirmed that PLR predicts
48
axis view either off of the frozen image with caliper function or with well the response to subsequent volume challenge. 45,51-56 A major advan-
M-mode imaging. The diameter is measured 2 to 3 cm below the right tage of PLR over other dynamic predictors described below is that
atrium or just caudad to the inlet of the hepatic veins at end expira- it appears accurate even in spontaneously breathing patients and
tion. There is only a weak correlation between fluid responsiveness those with irregular cardiac rhythms. A downside is related to uncer-
and the minimum or maximum IVC diameter (r = 0.58 and 0.44, tainties regarding the technique of raising the legs. In some studies, this
respectively). 34 has been accomplished using a specialized bed that simultaneously
raises the legs and lowers the head, keeping the angle between the
Global End-Diastolic Volume and Intrathoracic Blood Volume: A single- legs and the trunk constant. In other studies, the legs have been
indicator, transpulmonary thermodilution technique uses injected cold lifted manually while lowering the head, but this raises concern for
saline and a thermistor-tipped arterial catheter to estimate the maxi- standardization, differing angles between the legs and the trunk,
mal cardiac (four-chamber) volume. In a series of septic subjects, this sympathetic effects related to patient discomfort, and difficulties in
global end-diastolic volume was a modestly accurate predictor of the morbidly obese. PLR may not be valid when intra-abdominal
fluid responsiveness (positive predictive value .77 when in the lowest pressure is significantly elevated, although it has proven accurate in
tercile; negative predictive value .77 when in the highest tercile). The late-term pregnancy. 54,57
49
mathematically related intrathoracic blood volume would be expected
to be of similar accuracy. Dynamic Predictors Relying on Perturbing the Pleural Pressure: Cyclic
■ DYNAMIC MEASURES TO PREDICT FLUID RESPONSIVENESS changes in pleural pressure during ventilation induce fluctuations
in right heart filling, pulmonary venous volume, and both right and
As reliance on static preload measures has faded, interest in dynamic LV afterload. The rise in pleural pressure during positive pressure
predictors has heightened. Rather than relying on fixed hemodynamic inspiration augments LV filling (due, in part, to compression of
values, these metrics perturb the circulation by centralizing the blood pulmonary veins and rising LV compliance as the right heart fills
volume or altering the pleural pressure, then assess some output such as less) and simultaneously lowers LV afterload. These factors combine
stroke volume or pulse pressure (Table 34-1). to transiently raise the LV stroke volume and the systolic arterial
pressure. Also during inspiration the rise in pleural pressure impedes
Passive Leg Raising: Passive leg raising (PLR) has been used in several right heart filling transiently, the effects of which become evident in
studies as a surrogate for volume challenge due to ease of perfor- the arterial pressure wave several beats later (during expiration) as
mance and lack of adverse effects related to volume overload. PLR a fall in systolic pressure (and stroke volume). In most patients, the
shifts blood volume centrally, acting as a substantial but reversible respiratory impact on RV preload dominates to account for variations
volume challenge. Patients are studied first in the semirecumbent in stroke volume, while the consequences for RV and LV afterload
position, then the head is lowered and the legs are raised, generally and LV filling are minor. Occasionally, however, the effects on after-
using a specialized bed. A measure of cardiac output, such as echo- load or LV filling are not trivial. For example, in patients with acute
cardiographic left ventricular outflow tract velocity-time integral cor pulmonale the modest ventilation-induced rise in RV afterload
(LVOT-VTI) (from the transthoracic five-chamber view) or one of may contribute greatly to respiratory variation, falsely predicting
fluid responsiveness. If not recognized as being due to RV failure,
58
this variation might prompt harmful additional fluids, compounding
the shock. A variation on the use of ventilator-induced changes is the
end-expiratory occlusion test in which the ventilator is paused for
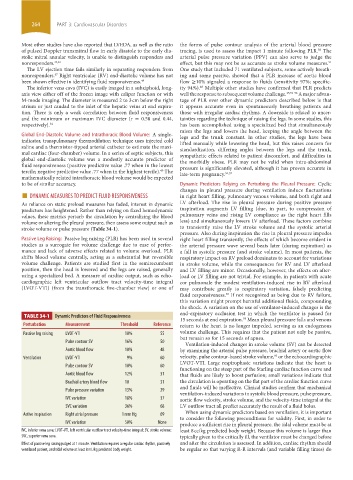
TABLE 34-1 Dynamic Predictors of Fluid Responsiveness
15 seconds at end expiration. Mean pleural pressure falls and venous
59
Perturbation Measurement Threshold Reference return to the heart is no longer impeded, serving as an endogenous
Passive leg raising LVOT-VTI 10% 55 volume challenge. This requires that the patient not only be passive,
Pulse contour SV 16% 50 but remain so for 15 seconds of apnea.
Ventilation-induced changes in stroke volume (SV) can be detected
Aortic blood flow 10% 48 by examining the arterial pulse pressure, brachial artery or aortic flow
60
Ventilation LVOT-VTI 9% 60 velocity, pulse contour-based stroke volume, or the echocardiographic
LVOT-VTI. Large respirophasic variations indicate that the heart is
Pulse contour SV 10% 60 functioning on the steep part of the Starling cardiac function curve and
Aortic blood flow 12% 31 that fluids are likely to boost perfusion; small variations indicate that
Brachial artery blood flow 10 31 the circulation is operating on the flat part of the cardiac function curve
and fluids will be ineffective. Clinical studies confirm that mechanical
Pulse pressure variation 13% 29
ventilation-induced variations in systolic blood pressure, pulse pressure,
IVC variation 18% 37 aortic flow velocity, stroke volume, and the velocity-time integral at the
SVC variation 36% 68 LV outflow tract all predict accurately the result of a fluid bolus.
Active inspiration Right atrial pressure 1 mm Hg 69 When using dynamic predictors based on ventilation, it is important
to consider the following preconditions for validity. First, in order to
IVC variation 50% None produce a sufficient rise in pleural pressure, the tidal volume must be at
IVC, inferior vena cava; LVOT-VTI, left ventricular outflow tract velocity-time integral; SV, stroke volume; least 8 cc/kg predicted body weight. Because this volume is larger than
SVC, superior vena cava. typically given to the critically ill, the ventilator must be changed before
Effect of passive leg raising judged at 1 minute. Ventilation requires a regular cardiac rhythm, passively and after the circulation is assessed. In addition, cardiac rhythm should
ventilated patient, and tidal volume at least 8 mL/kg predicted body weight. be regular so that varying R-R intervals (and variable filling times) do
section03.indd 264 1/23/2015 2:06:59 PM