
Page 79 - Color Atlas Of Pathophysiology (S Silbernagl Et Al, Thieme 2000)
P. 79
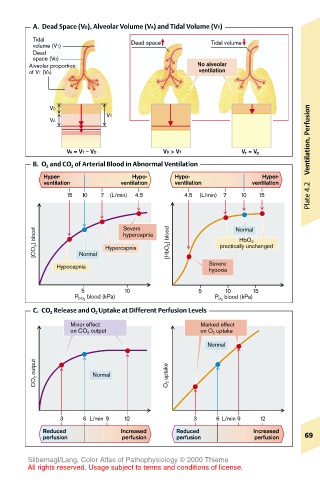
A.  Dead Space (VD), Alveolar Volume (VA) and Tidal Volume (VT)
        Tidal                  Dead space        Tidal volume
        volume (VT)
        Dead
        space (VD)
        Alveolar proportion                  No alveolar
        of VT (VA)                            ventilation


                                                                       Ventilation, Perfusion
            VD
                         VT
            VA

                VA = VT   – VD        VD   > VT        V T  = V D
        B.  O 2  and CO 2  of Arterial Blood in Abnormal Ventilation
           Hyper-              Hypo-    Hypo-               Hyper-
           ventilation      ventilation  ventilation      ventilation
                                                                       Plate 4.2
                15  10  7  (L/min)  4.5   4.5  (L/min)  7  10  15


                             Severe
                                                      Normal
         [CO 2 ] blood  Normal  Hypercapnia  [HbO 2 ] blood  practically unchanged
                             hypercapnia
                                                       HbO 2
              Hypocapnia                        Severe
                                                hypoxia
                   5         10               5     10    15
                  P CO 2  blood (kPa)            P O 2  blood (kPa)
        C.  CO 2  Release and O 2  Uptake at Different Perfusion Levels
                 Minor effect                 Marked effect
                 on CO 2  output              on O 2  uptake
                                                Normal
         CO 2  output  Normal          O 2  uptake


               3    6 L/min  9  12           3    6 L/min  9  12
           Reduced          Increased    Reduced          Increased
           perfusion        perfusion    perfusion        perfusion   69

       Silbernagl/Lang, Color Atlas of Pathophysiology © 2000 Thieme
       All rights reserved. Usage subject to terms and conditions of license.