
Page 593 - ACCCN's Critical Care Nursing
P. 593
570 P R I N C I P L E S A N D P R A C T I C E O F C R I T I C A L C A R E
data in post-injury MODS indicates a reduction in mor- variations of SOFA-based models have emerged in the
tality rates to 14–27%. 65,66 This decrease in mortality is literature, such as single SOFA scores calculated at admis-
occurring despite increasing patient acuity and may reflect sion or at a set time after admission, sequential SOFA
improvements in the delivery of critical care. 6 scores (mean SOFA score), dynamic SOFA scores and
scores of separate SOFA components. 69,70 SOFA scores at
admission are comparable with severity of illness models
SCORING SYSTEMS such as APACHE or SAPS for predicting mortality. SOFA
70
Organ dysfunction can be a consequence of a primary scoring has the advantage of ease of use, as the clinical
insult or a secondary insult due to circulating mediators and laboratory data required are those that are routinely
(e.g. the patient with ALI from pneumonia that also has available. As such, the use of dynamic SOFA scoring as a
renal dysfunction or failure as a consequence). This is means of monitoring patient response to treatments is
69,71
sometimes quantified by scoring systems, traditionally being explored.
used for predicting mortality but increasingly being
explored as clinical management tools. 69-71 These systems OTHER FACTORS
are continually being tested and modified, to assess organ Biomarkers such as lactate and strong ion gap (SIG) are
dysfunction severity and prognosis in an effort to identify also being studied as indicators of occult hypoperfusion
patients who will benefit most from timely clinical inter- and severity of organ dysfunction. Blood lactate levels are
71
vention. Scoring systems such as APACHE (acute physio- associated with SOFA scores, particularly in the early
logy and chronic health evaluation), SAPS (simplified stage of ICU admission, supporting early resuscitation as
acute physiology score) and MPM (mortality probability a management strategy to prevent organ dysfunction.
models) account for information relating to a 24-hour Serial lactate scores may therefore be appropriate to
cycle of patient data (commonly in the first 24 hours of guiding optimal oxygen delivery in early resuscitation,
admission), but do not account for the dynamic nature with hyperlactataemia a sign of impending organ dys-
of many of the factors that affect clinical outcomes. function. Prospective, well-controlled studies are however
needed to confirm the role of lactate and SIG in MODS
Specific instruments designed to assess organ dysfunction 74-76
or failure include the sepsis-related/sequential organ management.
failure assessment (SOFA) score, the multiple organ Variations in the human DNA sequences can affect the
dysfunction score and the logistic organ dysfunction way a person responds to disease. Researchers have
system. 70,72 Traditionally SOFA uses the worst values for studied the gene code for PAI-1 which is a key element
six commonly measured clinical parameters within a in the inhibition of fibrinolysis and is active during acute
24-hour period: PaO 2 /FiO 2 (P/F ratio), an index that may inflammation (the gene most studied is found at the
77
be used to characterise acute respiratory distress syn- 4G/5G insertion/deletion loci), finding that different
73
drome; platelet count, bilirubin level, blood pressure, aspects bind as either a repressor (5G) or activator (4G)
Glasgow Coma Scale score, and urine output or creati- protein. For example, the 4G allele (position on the gene)
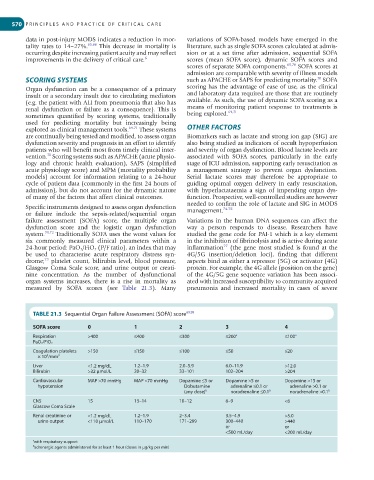
nine concentration. As the number of dysfunctional of the 4G/5G gene sequence variation has been associ-
organ systems increases, there is a rise in mortality as ated with increased susceptibility to community acquired
measured by SOFA scores (see Table 21.3). Many pneumonia and increased mortality in cases of severe
TABLE 21.3 Sequential Organ Failure Assessment (SOFA) score 69,99
SOFA score 0 1 2 3 4
Respiration >400 ≤400 ≤300 ≤200 a ≤100 a
PaO 2 /FiO 2
Coagulation platelets >150 ≤150 ≤100 ≤50 ≤20
3
× 10 /mm 3
Liver <1.2 mg/dL 1.2–1.9 2.0–5.9 6.0–11.9 >12.0
Bilirubin >32 µmol/L 20–32 33–101 102–204 >204
Cardiovascular MAP >70 mmHg MAP <70 mmHg Dopamine ≤5 or Dopamine >5 or Dopamine >15 or
hypotension Dobutamine adrenaline ≤0.1 or adrenaline >0.1 or
(any dose) b noradrenaline ≤0.1 b noradrenaline >0.1 b
CNS 15 13–14 10–12 6–9 <6
Glascow Coma Scale
Renal creatinine or <1.2 mg/dL 1.2–1.9 2–3.4 3.5–4.9 >5.0
urine output <110 µmol/L 110–170 171–299 300–440 >440
or or
<500 mL/day <200 mL/day
a with respiratory support
b adrenergic agents administered for at least 1 hour (doses in µg/kg per min)