
Page 1062 - Hematology_ Basic Principles and Practice ( PDFDrive )
P. 1062
Chapter 60 Myelodysplastic Syndromes 945
A B C
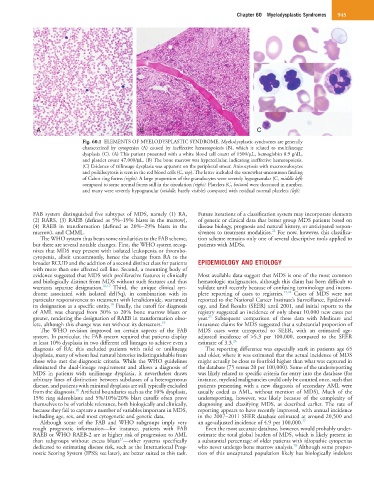
Fig. 60.1 ELEMENTS OF MYELODYSPLASTIC SYNDROME. Myelodysplastic syndromes are generally
characterized by cytopenias (A) caused by ineffective hematopoiesis (B), which is related to multilineage
dysplasia (C). (A) This patient presented with a white blood cell count of 1500/µL, hemoglobin 8.9 g/dL,
and platelet count 47,000/µL. (B) The bone marrow was hypercellular, indicating ineffective hematopoiesis.
(C) Evidence of trilineage dysplasia was apparent on the peripheral smear. Anisocytosis with macroovalocytes
and poikilocytosis is seen in the red blood cells (C, top). The latter included the somewhat uncommon finding
of Cabot ring forms (right). A large proportion of the granulocytes were severely hypogranular (C, middle left)
compared to some normal forms still in the circulation (right). Platelets (C, bottom) were decreased in number,
and many were severely hypogranular (middle, barely visible) compared with residual normal platelets (left).
FAB system distinguished five subtypes of MDS, namely (1) RA, Future iterations of a classification system may incorporate elements
(2) RARS, (3) RAEB (defined as 5%–19% blasts in the marrow), of genetic or clinical data that better group MDS patients based on
(4) RAEB in transformation (defined as 20%–29% blasts in the disease biology, prognosis and natural history, or anticipated respon-
22
marrow), and CMML. siveness to treatment modalities. For now, however, this classifica-
The WHO system thus bears some similarities to the FAB scheme, tion scheme remains only one of several descriptive tools applied to
but there are several notable changes. First, the WHO system recog- patients with MDSs.
nizes that MDS may present with isolated leukopenia or thrombo-
cytopenia, albeit uncommonly, hence the change from RA to the
broader RCUD and the addition of a second distinct class for patients EPIDEMIOLOGY AND ETIOLOGY
with more than one affected cell line. Second, a mounting body of
evidence suggested that MDS with proliferative features is clinically Most available data suggest that MDS is one of the most common
and biologically distinct from MDS without such features and thus hematologic malignancies, although this claim has been difficult to
warrants separate designation. 16,17 Third, the unique clinical syn- validate until recently because of confusing terminology and incom-
drome associated with isolated del(5q), in combination with its plete reporting of cases to registries. 23,24 Cases of MDS were not
particular responsiveness to treatment with lenalidomide, warranted reported to the National Cancer Institute’s Surveillance, Epidemiol-
18
its designation as a specific entity. Finally, the cutoff for diagnosis ogy, and End Results (SEER) until 2001, and initial reports to the
of AML was changed from 30% to 20% bone marrow blasts or registry suggested an incidence of only about 10,000 new cases per
25
greater, rendering the designation of RAEB in transformation obso- year. Subsequent comparison of these data with Medicare and
lete, although this change was not without its detractors. 19 insurance claims for MDS suggested that a substantial proportion of
The WHO revision improved on certain aspects of the FAB MDS cases went unreported to SEER, with an estimated age-
system. In particular, the FAB system required that patients display adjusted incidence of >5.3 per 100,000, compared to the SEER
at least 10% dysplasia in two different cell lineages to achieve even a estimate of 3.3. 26
diagnosis of RA; this excluded patients with mild or unilineage The reporting difference was especially stark in patients age 65
dysplasia, many of whom had natural histories indistinguishable from and older, where it was estimated that the actual incidence of MDS
those who met the diagnostic criteria. While the WHO guidelines might actually be close to fourfold higher than what was captured in
eliminated the dual-lineage requirement and allows a diagnosis of the database (75 versus 20 per 100,000). Some of the underreporting
MDS in patients with unilineage dysplasia, it nevertheless draws was likely related to specific criteria for entry into the database (for
arbitrary lines of distinction between subclasses of a heterogeneous instance, myeloid malignancies could only be counted once, such that
disease, and patients with minimal dysplasia are still typically excluded patients presenting with a new diagnosis of secondary AML were
20
from the diagnosis. Artificial boundaries such as the 10% dysplasia, usually coded as AML, without mention of MDS). Much of the
15% ring sideroblasts and 5%/10%/20% blast cutoffs often prove underreporting, however, was likely because of the complexity of
themselves to be of variable relevance, both biologically and clinically, diagnosing and classifying MDS, as described earlier. The rate of
because they fail to capture a number of variables important in MDS, reporting appears to have recently improved, with annual incidence
including age, sex, and most cytogenetic and genetic data. in the 2007–2011 SEER database estimated at around 20,500 and
Although some of the FAB and WHO subgroups imply very an age-adjusted incidence of 4.9 per 100,000. 27
rough prognostic information—for instance, patients with FAB Even the most accurate database, however, would probably under-
RAEB or WHO RAEB-2 are at higher risk of progression to AML estimate the total global burden of MDS, which is likely present in
21
than subgroups without excess blasts —other systems specifically a substantial percentage of older patients with idiopathic cytopenias
28
dedicated to estimating disease risk, such as the International Prog- who never undergo bone marrow analysis. Although some propor-
nostic Scoring System (IPSS; see later), are better suited to this task. tion of this uncaptured population likely has biologically indolent