
Page 1480 - Williams Hematology ( PDFDrive )
P. 1480
1454 Part X: Malignant Myeloid Diseases Chapter 89: Chronic Myelogenous Leukemia and Related Disorders 1455
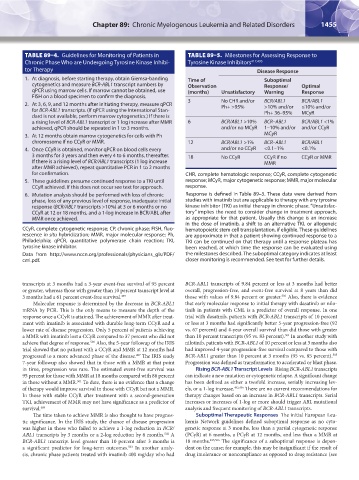
TABLE 89–4. Guidelines for Monitoring of Patients in TABLE 89–5. Milestones for Assessing Response to
Chronic Phase Who are Undergoing Tyrosine Kinase Inhibi- Tyrosine Kinase Inhibitors 417,495
tor Therapy Disease Response
1. At diagnosis, before starting therapy, obtain Giemsa-banding Time of Suboptimal
cytogenetics and measure BCR-ABL1 transcript numbers by Observation Response/ Optimal
qPCR using marrow cells. If marrow cannot be obtained, use (months) Unsatisfactory Warning Response
FISH on a blood specimen to confirm the diagnosis.
2. At 3, 6, 9, and 12 months after initiating therapy, measure qPCR 3 No CHR and/or BCR/ABL1 BCR/ABL1
≤10% and/or
>10% and/or
Ph+ >95%
for BCR-ABL1 transcripts. (If qPCR using the International Stan- Ph+ 36–95% MCyR
dard is not available, perform marrow cytogenetics.) If there is
a rising level of BCR-ABL1 transcript or 1 log increase after MMR 6 BCR/ABL1 >10% BCR–ABL1 BCR/ABL1 <1%
achieved, qPCR should be repeated in 1 to 3 months. and/or no MCyR 1–10% and/or and/or CCyR
3. At 12 months obtain marrow cytogenetics for cells with Ph MCyR
chromosome if no CCyR or MMR. 12 BCR/ABL1 >1% BCR–ABL1 BCR/ABL1
4. Once CCyR is obtained, monitor qPCR on blood cells every and/or no CCyR <0.1–1% <0.1%
3 months for 3 years and then every 4 to 6 months, thereafter. 18 No CCyR CCyR if no CCyR or MMR
If there is a rising level of BCR/ABL1 transcripts (1 log increase MMR
after MMR achieved), repeat quantitative PCR in 1 to 2 months
for confirmation. CHR, complete hematologic response; CCyR, complete cytogenetic
5. These guidelines presume continued response to a TKI until response; MCyR, major cytogenetic response; MMR, major molecular
CCyR achieved. If this does not occur see text for approach. response.
6. Mutation analysis should be performed with loss of chronic Response is defined in Table 89–3. These data were derived from
phase, loss of any previous level of response, inadequate initial studies with imatinib but are applicable to therapy with any tyrosine
response (BCR/ABL1 transcripts >10%) at 3 or 6 months or no kinase inhibitor (TKI) as initial therapy in chronic phase. “Unsatisfac-
CCyR at 12 or 18 months, and a 1-log increase in BCR/ABL after tory” implies the need to consider change in treatment approach,
MMR once achieved. as appropriate for that patient. Usually this change is an increase
in the dose of imatinib, a shift to an alternative TKI, or allogeneic
CCyR, complete cytogenetic response; CP, chronic phase; FISH, fluo- hematopoietic stem cell transplantation, if eligible. These guidelines
rescence in situ hybridization; MMR, major molecular response; Ph, are approximate in that a patient showing continued response to a
Philadelphia; qPCR, quantitative polymerase chain reaction; TKI, TKI can be continued on that therapy until a response plateau has
tyrosine kinase inhibitor. been reached, at which time the response can be evaluated using
Data from http://www.nccn.org/professionals/physicians_gls/PDF/ the milestones described. The suboptimal category indicates at least
cml.pdf. closer monitoring is recommended. See text for further details.
transcripts at 3 months had a 3-year event-free survival of 95 percent BCR-ABL1 transcripts of 9.84 percent or less at 3 months had better
or greater, whereas those with greater than 10 percent transcript level at overall, progression-free, and event-free survival at 8 years than did
503
3 months had a 61 percent event-free survival. 499 those with values of 9.84 percent or greater. Also, there is evidence
Molecular response is determined by the decrease in BCR-ABL1 that early molecular response to initial therapy with dasatinib or nilo-
mRNA by PCR. This is the only means to measure the depth of the tinib in patients with CML is a predictor of overall response. In one
response once a CCyR is attained. The achievement of MMR after treat- trial with dasatinib, patients with BCR-ABL1 transcripts of 10 percent
ment with imatinib is associated with durable long-term CCyR and a or less at 3 months had significantly better 5-year progression-free (92
lower rate of disease progression. Only 5 percent of patients achieving vs. 67 percent) and 4-year overall survival than did those with greater
504
a MMR with imatinib lost a CCyR compared to 37 percent who did not than 10 percent transcripts (95 vs. 83 percent). In another study with
500
achieve that degree of response. Also, the 5-year followup of the IRIS nilotinib, patients with BCR-ABL1 of 10 percent or less at 3 months also
trial showed that no patient with a CCyR and MMR at 12 months had had improved 4-year progression-free survival compared to those with
497
progressed to a more advanced phase of the disease. The IRIS study BCR-ABL1 greater than 10 percent at 3 months (95 vs. 85 percent).
505
7-year followup also showed that in those with a MMR at that point Progression was defined as transformation to accelerated or blast phase.
in time, progression was rare. The estimated event-free survival was Rising BCR-ABL1 Transcript Levels Rising BCR-ABL1 transcripts
95 percent for those with MMR at 18 months compared with 86 percent can indicate a new mutation or cytogenetic relapse. A significant change
in those without a MMR. To date, there is no evidence that a change has been defined as either a twofold increase, serially increasing lev-
501
of therapy would improve survival in those with CCyR but not a MMR. els, or a 1-log increase. 492,495 There are no current recommendations for
In those with stable CCyR after treatment with a second-generation therapy changes based on an increase in BCR-ABL1 transcripts. Serial
TKI, achievement of MMR may not have significance as a predictor of increases or increases of 1-log or more should trigger ABL mutational
survival. 499 analysis and frequent monitoring of BCR-ABL1 transcripts.
The time taken to achieve MMR is also thought to have prognos- Suboptimal Therapeutic Responses The initial European Leu-
tic significance. In the IRIS study, the chance of disease progression kemia Network guidelines defined suboptimal response as no cyto-
was higher in those who failed to achieve a 1-log reduction in BCR/ genetic response at 3 months, less than a partial cytogenetic response
ABL1 transcripts by 3 months or a 2-log reduction by 6 months. A (PCyR) at 6 months, a PCyR at 12 months, and less than a MMR at
502
BCR-ABL1 transcript level greater than 10 percent after 3 months is 18 months. 495,506 The significance of a suboptimal response is depen-
a significant predictor for long-term outcomes. In another analy- dent on the cause; for example, this may be insignificant if the result of
503
sis, chronic phase patients treated with imatinib 400 mg/day who had drug intolerance or noncompliance as opposed to drug resistance (see
Kaushansky_chapter 89_p1437-1490.indd 1455 9/18/15 3:41 PM