
Page 56 - Williams Hematology ( PDFDrive )
P. 56
32 Part I: Clinical Evaluation of the Patient Chapter 3: Examination of the Marrow 33
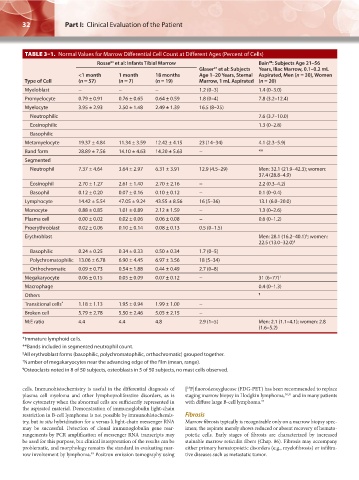
TABLE 3–1. Normal Values for Marrow Differential Cell Count at Different Ages (Percent of Cells)
Rosse et al: Infants Tibial Marrow Bain : Subjects Age 21–56
98
64
97
Glaser et al: Subjects Years, Iliac Marrow, 0.1–0.2 mL
<1 month 1 month 18 months Age 1–20 Years, Sternal Aspirated, Men (n = 30), Women
Type of Cell (n = 57) (n = 7) (n = 19) Marrow, 1 mL Aspirated (n = 20)
Myeloblast − − − 1.2 (0–3) 1.4 (0–3.0)
Promyelocyte 0.79 ± 0.91 0.76 ± 0.65 0.64 ± 0.59 1.8 (0–4) 7.8 (3.2–12.4)
Myelocyte 3.95 ± 2.93 2.50 ± 1.48 2.49 ± 1.39 16.5 (8–25)
Neutrophilic 7.6 (3.7–10.0)
Eosinophilic 1.3 (0–2.8)
Basophilic
Metamyelocyte 19.37 ± 4.84 11.34 ± 3.59 12.42 ± 4.15 23 (14–34) 4.1 (2.3–5.9)
Band form 28.89 ± 7.56 14.10 ± 4.63 14.20 ± 5.63 − **
Segmented
Neutrophil 7.37 ± 4.64 3.64 ± 2.97 6.31 ± 3.91 12.9 (4.5–29) Men: 32.1 (21.9–42.3); women:
37.4 (28.8–4.9)
Eosinophil 2.70 ± 1.27 2.61 ± 1.40 2.70 ± 2.16 − 2.2 (0.3–4.2)
Basophil 0.12 ± 0.20 0.07 ± 0.16 0.10 ± 0.12 − 0.1 (0–0.4)
Lymphocyte 14.42 ± 5.54 47.05 ± 9.24 43.55 ± 8.56 16 (5–36) 13.1 (6.0–20.0)
Monocyte 0.88 ± 0.85 1.01 ± 0.89 2.12 ± 1.59 − 1.3 (0–2.6)
Plasma cell 0.00 ± 0.02 0.02 ± 0.06 0.06 ± 0.08 − 0.6 (0–1.2)
Proerythroblast 0.02 ± 0.06 0.10 ± 0.14 0.08 ± 0.13 0.5 (0–1.5)
§
Erythroblast Men: 28.1 (16.2–40.1) ; women:
22.5 (13.0–32.0) §
Basophilic 0.24 ± 0.25 0.34 ± 0.33 0.50 ± 0.34 1.7 (0–5)
Polychromatophilic 13.06 ± 6.78 6.90 ± 4.45 6.97 ± 3.56 18 (5–34)
Orthochromatic 0.09 ± 0.73 0.54 ± 1.88 0.44 ± 0.49 2.7 (0–8)
Megakaryocyte 0.06 ± 0.15 0.05 ± 0.09 0.07 ± 0.12 − 31 (6–77) †
Macrophage 0.4 (0–1.3)
Others ¶
Transitional cells * 1.18 ± 1.13 1.95 ± 0.94 1.99 ± 1.00 −
Broken cell 5.79 ± 2.78 5.50 ± 2.46 5.05 ± 2.15 −
M:E ratio 4.4 4.4 4.8 2.9 (1–5) Men: 2.1 (1.1–4.1); women: 2.8
(1.6–5.2)
*Immature lymphoid cells.
**Bands included in segmented neutrophil count.
§ All erythroblast forms (basophilic, polychromatophilic, orthochromatic) grouped together.
† Number of megakaryocytes near the advancing edge of the film (mean, range).
¶ Osteoclasts noted in 8 of 50 subjects, osteoblasts in 5 of 50 subjects, no mast cells observed.
18
cells. Immunohistochemistry is useful in the differential diagnosis of [ F]fluorodeoxyglucose (FDG-PET) has been recommended to replace
plasma cell myeloma and other lymphoproliferative disorders, as is staging marrow biopsy in Hodgkin lymphoma, 50,51 and in many patients
flow cytometry when the abnormal cells are sufficiently represented in with diffuse large B-cell lymphoma. 52
the aspirated material. Demonstration of immunoglobulin light-chain
restriction in B-cell lymphoma is not possible by immunohistochemis- Fibrosis
try, but in situ hybridization for κ versus λ light-chain messenger RNA Marrow fibrosis typically is recognizable only on a marrow biopsy spec-
may be successful. Detection of clonal immunoglobulin gene rear- imen; the aspirate merely shows reduced or absent recovery of hemato-
rangements by PCR amplification of messenger RNA transcripts may poietic cells. Early stages of fibrosis are characterized by increased
be used for this purpose, but clinical interpretation of the results can be stainable marrow reticulin fibers (Chap. 86). Fibrosis may accompany
problematic, and morphology remains the standard in evaluating mar- either primary hematopoietic disorders (e.g., myelofibrosis) or infiltra-
row involvement by lymphoma. Positron emission tomography using tive diseases such as metastatic tumor.
49
Kaushansky_chapter 03_p0027-0040.indd 32 17/09/15 5:37 pm