
Page 60 - Williams Hematology ( PDFDrive )
P. 60
36 Part I: Clinical Evaluation of the Patient Chapter 3: Examination of the Marrow 37
with more simultaneous colors places greater demand on resources for
development, maintenance and ongoing quality assurance. Most clini-
cally important phenotypic markers are analyzed as cell surface proteins
by directly adding conjugated antibodies to cell suspension, followed
by washing and lysis of red cells. Assessment of intracytoplasmic and
73
nuclear-associated proteins is accomplished after staining for surface
makers by then fixing cells in suspension and adding the relevant anti-
bodies in conjunction with a membrane-permeabilizing agent. Some
lineage-specific markers (CD3 in precursor T cells; CD79a and CD22
in B cells; myeloperoxidase in granulocyte lineage; cyclin D1 in mantle
cell lymphoma) are expressed only in the cytoplasm at certain stages of
development. Fluorescence and light scatter data are stored electron- A
ically as list mode data files that can be archived and later reanalyzed
using appropriate software. As the number of parameters collected on
individual cells increases, standard ways of looking at multiple two-
parameter histograms of gated cell populations become more difficult.
Data analysis techniques and automation appropriate to discovery and
interpretation of multidimensional data sets such as those generated by
various “-omics” analyses may become part of the multiparameter flow
cytometry workflow. 74,75 Computational methods for identifying cell
populations in highly multidimensional data sets have been shown to
be more effective in reliable and consistent identification of clinically
relevant cell populations in multicolor flow cytometry than manual gat-
76
ing and analysis, particularly in the context of a consensus approach
using an ensemble of algorithms, as is commonly done today in weather
forecasting.
B
GATING STRATEGIES
In heterogeneous specimens such as marrow, in which the relevant clin-
ical population (such as blasts) may be a minor population overall, a
strategy for specifically identifying the population(s) of interest is neces-
sary. As discussed in Chap. 2, this is accomplished for blood cells by very
complex cluster analysis using multiple physical parameters. Because
the flow cytometer has a much more sophisticated analytical capability
at the back end with the fluorescent markers, the front-end selection of
cells is not intended to be definitive, but should include the cells of inter-
est and exclude nonrelevant cells, particularly those that may create an
interpretive problem if included in the analysis. This process, referred to
as gating, is typically accomplished by a combination of CD45 (common
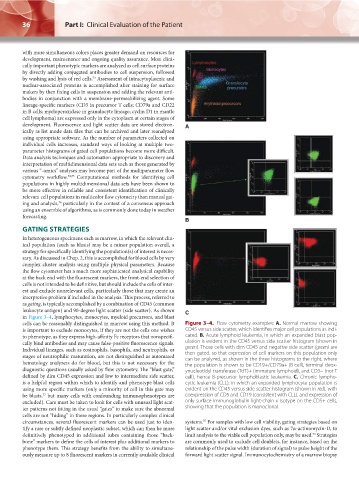
leukocyte antigen) and 90-degree light scatter (side scatter). As shown C
in Figure 3–4, lymphocytes, monocytes, myeloid precursors, and blast
cells can be reasonably distinguished in marrow using this method. It Figure 3–4. Flow cytometry examples: A. Normal marrow showing
is important to exclude monocytes, if they are not the cells one wishes CD45 versus side scatter, which identifies major cell populations as indi-
to phenotype, as they express high-affinity Fc receptors that nonspecifi- cated. B. Acute lymphoid leukemia, in which an expanded blast pop-
cally bind antibodies and may cause false-positive fluorescence signals. ulation is evident in the CD45 versus side scatter histogram (shown in
Individual lineages, such as eosinophils, basophils, and neutrophils, or green). Those cells with dim CD45 and negative side scatter (green) are
stages of neutrophilic maturation, are not distinguished as automated then gated, so that expression of cell markers on this population only
can be analyzed, as shown in the three histograms to the right, where
hematology analyzers do for blood, but this is not necessary for the the population is shown to be CD19+/CD79a+ (B cell), terminal deox-
diagnostic questions usually asked by flow cytometry. The “blast gate,” ynucleotidyl transferase (TdT)+ (immature lymphoid), and CD3− (not T
defined by dim CD45 expression and low to intermediate side scatter, cell), hence B-precursor lymphoblastic leukemia. C. Chronic lympho-
is a helpful region within which to identify and phenotype blast cells cytic leukemia (CLL), in which an expanded lymphocyte population is
using more specific markers (only a minority of cell in this gate may evident on the CD45 versus side scatter histogram (shown in red), with
be blasts, but many cells with confounding immunophenotypes are coexpression of CD5 and CD19 (consistent with CLL), and expression of
77
excluded). Care must be taken to look for cells with unusual light scat- only surface immunoglobulin light-chain κ isotype on the CD5+ cells,
ter patterns not fitting in the usual “gates” to make sure the abnormal showing that the population is monoclonal.
cells are not “hiding” in these regions. In particularly complex clinical
circumstances, several fluorescent markers can be used just to iden- systems. For samples with low cell viability, gating strategies based on
75
tify a rare or subtly defined neoplastic subset, which can then be more light scatter and/or vital exclusion dyes, such as 7α-actinomycin-D, to
definitively phenotyped in additional tubes containing those “back- limit analysis to the viable cell population only, may be used. Strategies
73
bone” markers to define the cells of interest plus additional markers to are commonly used to exclude cell doublets, for instance, based on the
phenotype them. This strategy benefits from the ability to simultane- relationship of the pulse width (duration of signal) to pulse height of the
ously measure up to 8 fluorescent markers in currently available clinical forward light scatter signal. Immunocytochemistry of a marrow biopsy
Kaushansky_chapter 03_p0027-0040.indd 36 17/09/15 5:38 pm