
Page 1278 - Clinical Immunology_ Principles and Practice ( PDFDrive )
P. 1278
1240 Part ElEvEn Diagnostic Immunology
Photodetectors: 1000
side scatter signal
Filters Fluorescent signals
PerCP 800 Granulocytes
PE
Laser FITC 600
light source Flow cell
Photodetector:
forward scatter signal SSC-H: SSC-Height 400 Monocytes
Focused cell stream 200
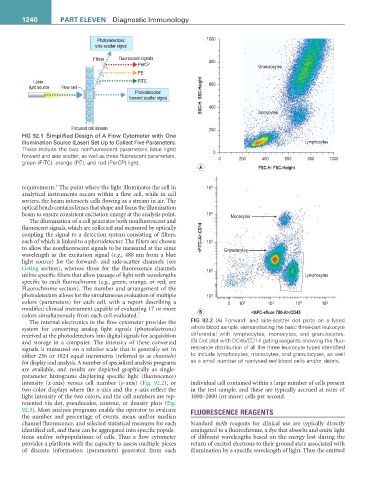
FIG 92.1 Simplified Design of A Flow Cytometer with One
Illumination Source (Laser) Set Up to Collect Five Parameters. Lymphocytes
These include the two nonfluorescent parameters (blue light)
forward and side scatter, as well as three fluorescent parameters, 0 0 200 400 600 800 1000
green (FITC), orange (PE), and red (PerCP) light.
A FSC-H: FSC-Height
6
requirements. The point where the light illuminates the cell in 10 5
analytical instruments occurs within a flow cell, while in cell
sorters, the beam intersects cells flowing as a stream in air. The
optical bench contains lenses that shape and focus the illumination
beam to ensure consistent excitation energy at the analysis point. 10 4 Monocytes
The illumination of a cell generates both nonfluorescent and
fluorescent signals, which are collected and measured by optically
coupling the signal to a detection system consisting of filters,
each of which is linked to a photodetector. The filters are chosen <FITC-A>:CD14 10 3
to allow the nonfluorescent signals to be measured at the same Granulocytes
wavelength as the excitation signal (e.g., 488 nm from a blue
light source) for the forward- and side-scatter channels (see
Gating section), whereas those for the fluorescence channels 10 2
utilize specific filters that allow passage of light with wavelengths Lymphocytes
specific to each fluorochrome (e.g., green, orange, or red; see
Fluorochrome section). The number and arrangement of the
photodetectors allows for the simultaneous evaluation of multiple 10 0
colors (parameters) for each cell, with a report describing a 0 10 2 10 3 10 4 10 5
modified clinical instrument capable of evaluating 17 or more B
colors simultaneously from each cell evaluated. 7 <APC-efluor 780-A>:CD45
The internal electronics in the flow cytometer provides the FIG 92.2 (A) Forward- and side-scatter dot plots on a lysed
system for converting analog light signals (photoelectrons) whole blood sample, demonstrating the basic three-part leukocyte
received at the photodetectors into digital signals for acquisition differential with lymphocytes, monocytes, and granulocytes.
and storage in a computer. The intensity of these converted (B) Dot plot with DC45/CD14 gating reagents showing the fluo-
signals is measured on a relative scale that is generally set in rescence distribution of all the three leukocyte types identified
either 256 or 1024 equal increments (referred to as channels) to include lymphocytes, monocytes, and granulocytes, as well
for display and analysis. A number of specialized analysis programs as a small number of nonlysed red blood cells and/or debris.
are available, and results are depicted graphically as single-
parameter histograms displaying specific light (fluorescence)
intensity (x-axis) versus cell number (y-axis) (Fig. 92.2), or individual cell contained within a large number of cells present
two-color displays where the x-axis and the y-axis reflect the in the test sample, and these are typically accrued at rates of
light intensity of the two colors, and the cell numbers are rep- 1000–2000 (or more) cells per second.
resented via dot, pseudocolor, contour, or density plots (Fig.
92.3). Most analysis programs enable the operator to evaluate FLUORESCENCE REAGENTS
the number and percentage of events, mean and/or median
channel fluorescence, and selected statistical measures for each Standard mAb reagents for clinical use are typically directly
identified cell, and these can be aggregated into specific popula- conjugated to a fluorochrome, a dye that absorbs and emits light
tions and/or subpopulations of cells. Thus a flow cytometer of different wavelengths based on the energy lost during the
provides a platform with the capacity to assess multiple pieces return of excited electrons to their ground state associated with
of discrete information (parameters) generated from each illumination by a specific wavelength of light. Thus the emitted