
Page 1280 - Clinical Immunology_ Principles and Practice ( PDFDrive )
P. 1280
1242 Part ElEvEn Diagnostic Immunology
The simplest method for demonstrating flow cytometry data is cellular autofluorescence together with any nonspecific binding
the single-parameter histogram (see Fig. 92.2), a graphic presenta- of the monoclonal reagent(s), and the magnitude of both
tion of cell number on the y-axis versus fluorescence (light) phenomena varies among different cell types. Interpretation of
intensity from a single fluorochrome on the x-axis. Integration data is simplified when there are two distinct cell populations
of curve areas provides the number of cells, and often there are (i.e., negative and positive), but the evaluation of two overlapping
two distinct distributions, one referred to as negative identifies distributions is more difficult.
cells that are not bound specifically by the monoclonal reagent, Multiparameter data can be evaluated by using a series of
and the second represents cells bound by the antibody. Negative single-parameter histograms that consider each fluorochrome
distribution actually reflects low-level fluorescence resulting from independently. However, it is more informative to present two
parameters simultaneously by using a correlated display (Fig.
92.4), and two-color displays are recommended for clinical flow
15
cytometry. This approach enables the simultaneous visualization
+
−
+
−
−
+
+
-
of four different populations: A /B , A /B , A /B , and A /B . More
recently, these displays were developed further to include a mixture
of logarithmic (for higher intensity expression) and linear (for
lower intensity expression) intensity for each axis to allow for
300 better interpretation of events with very low, zero, or negative
fluorescence. This combined-display approach resolves the
previous problem of a large number of events being displayed
compacted against the axes, even with properly compensated
samples, and will be used in the illustrations throughout this
# Cells 200 CD3+ chapter. 16
The simultaneous use of n monoclonal reagents can identify
n
a total of 2 subpopulations. These different subsets can be
CD3- identified sequentially by first dividing the cells into those that
are positive versus those that are negative with one reagent and
100
then evaluating the defined subpopulations for the remaining
two reagents using a two-color approach. Alternatively, more
modern software can represent multiple populations as poly-
17
chromatic plots, which can simplify data analysis. The poly-
chromatic approach can provide a means to further resolve
0 subpopulations and has been particularly useful in the evaluation
0 10 2 10 3 10 4 10 5
of cellular differentiation, activation, and functional correlates,
<FITC-A>:CD3 as well as clarifying overlapping cell subpopulations.
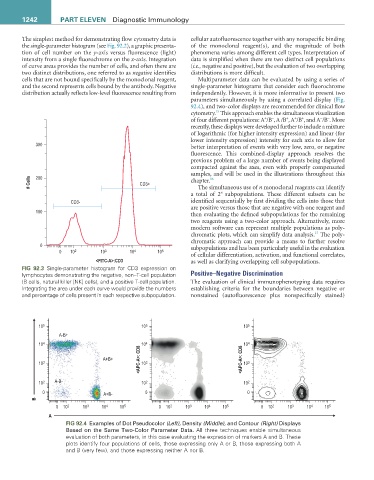
FIG 92.3 Single-parameter histogram for CD3 expression on
lymphocytes demonstrating the negative, non–T-cell population Positive–Negative Discrimination
(B cells, natural killer [NK] cells), and a positive T-cell population. The evaluation of clinical immunophenotyping data requires
Integrating the area under each curve would provide the numbers establishing criteria for the boundaries between negative or
and percentage of cells present in each respective subpopulation. nonstained (autofluorescence plus nonspecifically stained)
10 5 10 5 10 5
A-B+
10 4 4 4
<APC-A>: CD8 10 <APC-A>: CD8 10
A+B+
10 3 10 3 10 3
10 2 A-B- 10 2 10 2
0 A+B- 0 0
B
0 10 2 10 3 10 4 10 5 0 10 2 10 3 10 4 10 5 0 10 2 10 3 10 4 10 5
A
FIG 92.4 Examples of Dot Pseudocolor (Left), Density (Middle), and Contour (Right) Displays
Based on the Same Two-Color Parameter Data. All three techniques enable simultaneous
evaluation of both parameters, in this case evaluating the expression of markers A and B. These
plots identify four populations of cells, those expressing only A or B, those expressing both A
and B (very few), and those expressing neither A nor B.