
Page 1282 - Clinical Immunology_ Principles and Practice ( PDFDrive )
P. 1282
1244 Part ElEvEn Diagnostic Immunology
Isotype control
10 4 10 4
0.26 0.09 12.1 5.76
10 3 10 3
FITC-A: IgG FITC-A 10 2 FITC-A: HLA-DR FITC-A 10 2
10 1 10 1
99 0.62 26 56.2
10 0 10 0
10 0 10 1 10 2 10 3 10 4 10 0 10 1 10 2 10 3 10 4
PE-Cy7-A: IgG PE-Cy7-A PE-Cy7-A: CD3 PE-Cy7-A
FMO control
20.0 10 4 20.0 10 4
20.0 20.0
Lymh gate 10 3 CD3+ Lymh gate 10 3 CD3+
20.0 20.0
Title Title 10 2 Title Title 10 2
20.0 20.0
10 1 10 1
20.0 20.0
0 0 0 0
0 30.0 30.0 30.0 30.0 30.0 0 10 1 10 2 10 3 10 4 0 30.0 30.0 30.0 30.0 30.0 0 10 1 10 2 10 3 10 4
Title Title Title Title
10 4 10 4
10 3 0.43 10 3 78.9 10.1
PE-A: subclass PE-A 10 2 0.37 PE-A: FAS PE-A 10 2
10 1 10 1
10 0 10 0
10 0 10 1 10 2 10 3 10 4 10 0 10 1 10 2 10 3 10 4
APC-A: CD8 APC-A APC-A: CD8 APC-A
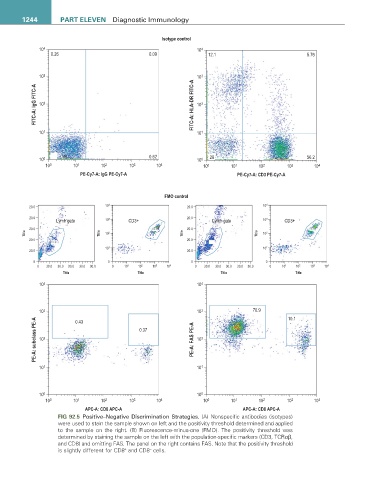
FIG 92.5 Positive–Negative Discrimination Strategies. (A) Nonspecific antibodies (isotypes)
were used to stain the sample shown on left and the positivity threshold determined and applied
to the sample on the right. (B) Fluorescence-minus-one (FMO). The positivity threshold was
determined by staining the sample on the left with the population-specific markers (CD3, TCRαβ,
and CD8) and omitting FAS. The panel on the right contains FAS. Note that the positivity threshold
is slightly different for CD8 and CD8 cells.
+
−