
Page 1152 - Hall et al (2015) Principles of Critical Care-McGraw-Hill
P. 1152
CHAPTER 86: Intracranial Pressure: Monitoring and Management 791
ICP monitoring or to consider other therapeutic maneuvers such as depiction of CBF remaining constant over a wide range of arterial blood
surgical decompression. pressures, at least in the normotensive noninjured brain, is presented in
Fig. 86-7. In chronically hypertensive individuals, the autoregulatory
■ CEREBRAL BLOOD FLOW AND CEREBRAL PERFUSION PRESSURE threshold is shifted to the right. Relative blood pressure lowering within
the autoregulatory range will be compensated by cerebral vasodilation
To appreciate the progressive detriment of elevated ICP, it is essential and a resultant increase in cerebral blood volume (CBV). Conversely,
to understand the factors involved in determining and controlling relative blood pressure elevations within an individual’s autoregulatory
cerebral blood flow (CBF). Neglecting, for a moment, that cerebral range leads to cerebral vasoconstriction and a subsequent decrease in
arteries are rather flexible conduits, CBF could be compared to elec- cerebral blood volume. The physiologic relationship between blood
tric current through a wire. Ohm described that this current (I) is pressure, CBF, CPP, and CVR is unpredictable in damaged brain regions
proportional to the difference in the potential (ΔV) placed across with impaired autoregulation. Both ischemia (regionally due to arterial
the ends of a wire and proportionally constant to the resistance (R) the occlusion or globally as in ischemic encephalopathy following cardiac
current faces while traveling through the wire. That is, current = arrest) and CBV dysregulation (eg, hyperemia) are critical determinants
potential difference/resistance (I = ΔV/R) or (ΔV = IR). Written of ICP, especially in the noncompliant, autoregulatory-paralyzed brain
in flow dynamic terms, CBF depends on the perfusion pressure already exposed to elevated ICPs from the primary injury. This practical
(CPP) divided by the vascular resistance (CVR) or CBF = CPP/CVR. understanding of cerebral hemodynamics, and the concept that CBF in
As CPP is calculated by the difference between the mean arterial the injured brain is almost entirely dependent on MAP, is critical for the
pressure (MAP) and the ICP, this equation can be rewritten as CBF = development of a rational therapeutic plan for patients with brain injury
MAP − ICP/CVR. CVR is governed by precapillary, brain penetrat- and intracranial hypertension.
ing arterioles and is tightly regulated by pressure autoregulation in a Regional CBF normally averages 50 to 60 mL/100 g/min, about 15% of
normal patient to provide a steady CBF with normal MAP fluctua- the cardiac output (about 700 mL/min). Assuming normal cellular meta-
tions. Autoregulation is a function of vasoactive mediators between bolic rate, increased oxygen extraction from the blood compensates for
neighboring vascular endothelial cells, adjacent smooth muscle, and reduced CBF until CBF reaches 50% of its baseline value, when the first
perivascular nerves. Dynamic increases in ICP can also be esti- clinical and electroencephalographic (EEG) manifestations of hypoperfu-
7,8
mated at the bedside by elevated blood flow velocities and pulsatility sion appear. Impairment of cortical activity becomes more marked at 16
indices as seen on transcranial Doppler (TCD). CVR changes can be to 18 mL/100 g/min with loss of neurotransmission due to Na-K pump
exhausted, however, leading to complete absence of flow if increased failure. Cytotoxic edema then occurs at 10 to 12 mL/100 g/min. At ranges
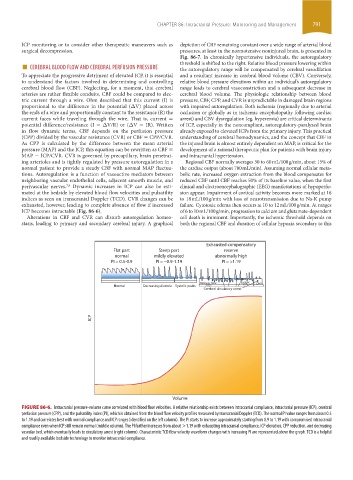
ICP becomes intractable (Fig. 86-6). of 6 to 10 mL/100 g/min, progression to calcium and glutamate-dependent
Alterations in CBF and CVR can disturb autoregulation homeo- cell death is imminent. Importantly, the ischemic threshold depends on
stasis, leading to primary and secondary cerebral injury. A graphical both the regional CBF and duration of cellular hypoxia secondary to this
Exhausted compensatory
Flat part Steep part reserve
normal mildly elevated abnormally high
PI = 0.5-0.9 PI = ~0.9-1.19 PI = >1.19
Biphasic flow Systolic Zero
Normal Decreasing diastole Systolic peaks ????? ????
Cerebral circulatory arrest
ICP
Volume
FIGURE 86-6. Intracranial pressure-volume curve correlated with blood flow velocities. A relative relationship exists between intracranial compliance, intracranial pressure (ICP), cerebral
perfusion pressure (CPP), and the pulsatility index (PI), which is obtained from the blood flow velocity profiles measured by transcranial Doppler (TCD). The normal PI value ranges from about 0.5
to 1.19 and correlates best with normal compliance and ICP ranges (identified on the left column). The PI starts to increase approximately starting from 0.9 to 1.19 with compromised intracranial
compliance even when ICP still remain normal (middle column). The PI further increases from about >1.19 with exhausting intracranial compliance, ICP elevation, CPP reduction, and decreasing
vascular bed, which eventually leads to circulatory arrest (right column). Characteristic TCD flow velocity waveform changes with increasing PI are represented above the graph. TCD is a helpful
and readily available bedside technology to monitor intracranial compliance.
section06.indd 791 1/23/2015 12:55:49 PM