
Page 278 - Clinical Hematology_ Theory _ Procedures ( PDFDrive )
P. 278
262 PART 4 ■ Erythrocyte Disorders
Pathophysiology - m . I m
A IDA m . T q - . H , -
m
m m m . E m q . P m
( . ). T m - .
■ S : P —
■ S : L — Chronic Blood Loss
■ S : A m — C q
m x GI , m
m m -
m . I m m x
Clinical Signs and Symptoms , m
. R RBC
T - . T m m
k .
m m , , / k . A m
P m m IDA. T m m m . A , m m -
m m m , m m . G ,
. A m m , m m -
m m . T WBC
m . P IDA m . P mm
x m , , ,
m . k .
IDA m m -
m m . C , m Genetics and Iron De ciency
U S m
f , % - G m
m , % IDA. m m. T
P , m - m m (SNP) m -
( . ., , k , k, ), m
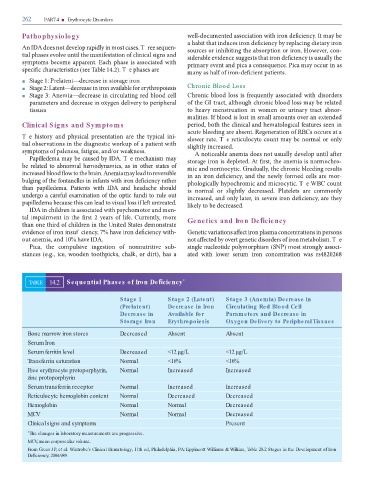
TABLE 14.2 Sequential Phases of Iron De ciency *
Stage 1 Stage 2 (Latent) Stage 3 (Anemia) Decrease in
(Prelatent) Decrease in Iron Circulating Red Blood Cell
Decrease in Available for Parameters and Decrease in
Storage Iron Erythropoiesis Oxygen Delivery to Peripheral Tissues
Bone marrow iron stores Decreased Absent Absent
Serum Iron
Serum ferritin level Decreased <12 µg/L <12 µg/L
Transferrin saturation Normal <16% <16%
Free erythrocyte protoporphyrin, Normal Increased Increased
zinc protoporphyrin
Serum transferrin receptor Normal Increased Increased
Reticulocyte hemoglobin content Normal Decreased Decreased
Hemoglobin Normal Normal Decreased
MCV Normal Normal Decreased
Clinical signs and symptoms Present
* The changes in laboratory measurements are progressive.
MCV mean corpuscular volume.
,
From Greer JP, et al. Wintrobe’s Clinical Hematology, 11th ed, Philadelphia, PA: Lippincott Williams & Wilkins, Table 28.2 Stages in the Development of Iron
De ciency, 2004:989.