
Page 50 - HOW TO PROVE IT: A Structured Approach, Second Edition
P. 50
P1: PIG/
0521861241c01 CB996/Velleman October 19, 2005 23:46 0 521 86124 1 Char Count= 0
36 Sentential Logic
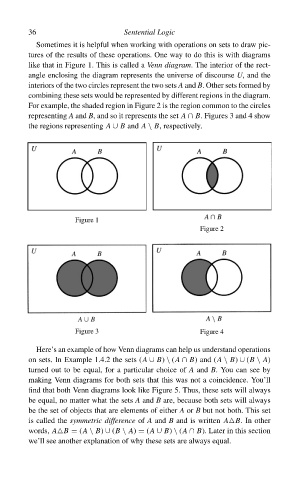
Sometimes it is helpful when working with operations on sets to draw pic-
tures of the results of these operations. One way to do this is with diagrams
like that in Figure 1. This is called a Venn diagram. The interior of the rect-
angle enclosing the diagram represents the universe of discourse U, and the
interiors of the two circles represent the two sets A and B. Other sets formed by
combining these sets would be represented by different regions in the diagram.
For example, the shaded region in Figure 2 is the region common to the circles
representing A and B, and so it represents the set A ∩ B. Figures 3 and 4 show
the regions representing A ∪ B and A \ B, respectively.
Figure 1
Figure 2
Figure 3 Figure 4
Here’s an example of how Venn diagrams can help us understand operations
on sets. In Example 1.4.2 the sets (A ∪ B) \ (A ∩ B) and (A \ B) ∪ (B \ A)
turned out to be equal, for a particular choice of A and B. You can see by
making Venn diagrams for both sets that this was not a coincidence. You’ll
find that both Venn diagrams look like Figure 5. Thus, these sets will always
be equal, no matter what the sets A and B are, because both sets will always
be the set of objects that are elements of either A or B but not both. This set
is called the symmetric difference of A and B and is written A B. In other
words, A B = (A \ B) ∪ (B \ A) = (A ∪ B) \ (A ∩ B). Later in this section
we’ll see another explanation of why these sets are always equal.