
Page 10 - PRE-U STPM CHEMISTRY TERM 1
P. 10
Chemistry Term 1 STPM
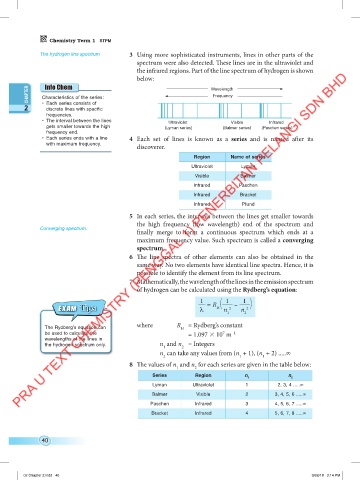
The hydrogen line spectrum 3 Using more sophisticated instruments, lines in other parts of the
spectrum were also detected. These lines are in the ultraviolet and
the infrared regions. Part of the line spectrum of hydrogen is shown
below:
Info Chem
CHAPTER Characteristics of the series: Wavelength
Frequency
2 • Each series consists of
discrete lines with specific
frequencies.
• The interval between the lines
Ultraviolet Visible Infrared
gets smaller towards the high (Lyman series) (Balmer series) (Paschen series)
frequency end.
4 Each set of lines is known as a series and is named after its
• Each series ends with a line
with maximum frequency.
discoverer.
Region Name of series
Ultraviolet Lyman
Visible Balmer
Infrared Paschen
Infrared Bracket
Infrared Pfund
5 In each series, the intervals between the lines get smaller towards
T
ips
Exam
Exam Tips the high frequency (low wavelength) end of the spectrum and
Converging spectrum.
finally merge to form a continuous spectrum which ends at a
maximum frequency value. Such spectrum is called a converging
spectrum.
6 The line spectra of other elements can also be obtained in the
same way. No two elements have identical line spectra. Hence, it is
possible to identify the element from its line spectrum.
7 Mathematically, the wavelength of the lines in the emission spectrum
of hydrogen can be calculated using the Rydberg’s equation:
1 = R 1 – 1
Tips
Exam T ips λ H n 2 n 2
Exam
1 2
where R = Rydberg’s constant
The Rydbergʼs equation can H
7
be used to calculate the = 1.097 10 m –1
wavelengths of the lines in
the hydrogen spectrum only. n and n = Integers
2
1
n can take any values from (n + 1), (n + 2) .....∞
2 1 1
8 The values of n and n for each series are given in the table below:
1 2
Series Region n n
1 2
Lyman Ultraviolet 1 2, 3, 4 .....∞
Balmer Visible 2 3, 4, 5, 6 .....∞
Paschen Infrared 3 4, 5, 6, 7 .....∞
Bracket Infrared 4 5, 6, 7, 8 .....∞
40
02 Chapter 2.indd 40 3/26/18 3:14 PM