Page 15 - PRE-U STPM CHEMISTRY TERM 1
P. 15

Chemistry Term 1  STPM

                                                              n = ∞

                                                 f
                                                  (maximum)

                                                                                                                CHAPTER
                                                              n = 1
                                                                                                               2
                                      15
                                3.29  10  Hz
                                                        Frequency
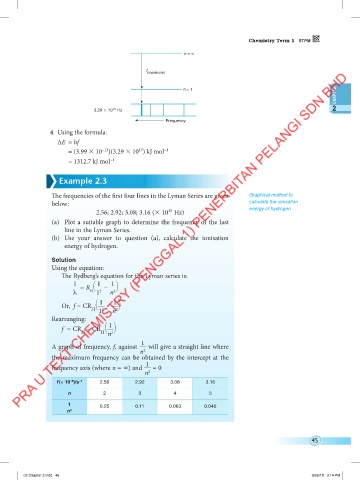
                  4  Using the formula:

                    ∆E  = hf
                                   –13
                                               15
                        = (3.99  10 )(3.29  10 ) kJ mol
                                                       –1
                        = 1312.7 kJ mol –1
                     Example 2.3


                  The frequencies of the first four lines in the Lyman Series are given   Graphical method to
                  below:                                                            calculate the ionisation
                                                         15
                                 2.56; 2.92; 3.08; 3.16 ( 10  Hz)                  energy of hydrogen
                  (a)  Plot a suitable graph to determine the frequency of the last
                      line in the Lyman Series.
                  (b)  Use  your  answer  to  question  (a),  calculate  the  ionisation
                      energy of hydrogen.

                  Solution
                  Using the equation:
                      The Rydberg’s equation for the Lyman series is:
                         1       1    1
                            = R    –  
                         λ     H  1 2  n 2
                                       1
                     Or,  f = CR   1  –  
                               H  1 2  n 2
                  Rearranging:
                                     1
                     f  = CR – CR  
                            H     H  n 2
                                                1
                  A graph of frequency, f, against    will give a straight line where
                                               n 2
                  the maximum frequency can be obtained by the intercept at the
                  frequency axis (where n = ∞) and   1   = 0
                                                 n 2

                        15
                    f (× 10 )/s –1  2.56      2.92        3.08       3.16
                        n          2           3           4          5
                        1
                                  0.25        0.11       0.063       0.040
                       n  2


                                                                                                        45


         02 Chapter 2.indd   45                                                                         3/26/18   3:14 PM
   10   11   12   13   14   15   16   17   18   19   20