Page 18 - TOP CLASS MATHS T5 KSSM
P. 18

Mathematics  Form 5  Chapter 7  Measures of Dispersion for Grouped Data


          7.2     Measures of Dispersion                                                              pg. 211 – 221
                                                                                                       Textbook
                  Sukatan Serakan

                SMART    Notes


                    Midpoint of the    Midpoint of the         4.  Standard deviation,
          1.  Range =   highest class   −   lowest class         Sisihan piawai,

                    Titik tengah      Titik tengah                        2
                                                                        Σfx
              Julat =   kelas tertinggi   −   kelas terendah       σ =  

                                                                            – x
                                                                             – 2
                                                                         Σf
          2.  Interquartile range/ Julat antara kuartil
                                                               5.  The smaller the standard deviation, the more consistent
             = Third quartile, Q 3  – First quartile, Q 1        is the data.

                Kuartil ketiga, Q 3  – Kuartil pertama, Q 1
                                                                 Semakin kecil sisihan piawai, semakin konsisten data itu.
          3.  Variance/ Varians,                               6.  Box plot
                  Σfx 2
              σ  =     – x                                       Plot kotak
               2
                        – 2
                   Σf
             where/ dengan keadaan
              x = midpoint of the class interval
                     titik tengah bagi selang kelas                        10 20 30 40 50 60 70 80
              f = frequency
                     kekerapan                                                   Mass (kg)/ Jisim (kg)
             –
               x  = mean of the data
                   min data
         10.  Determine the range and interquartile range for the following distributions.  PL 3
             Tentukan julat dan julat antara kuartil bagi taburan berikut.
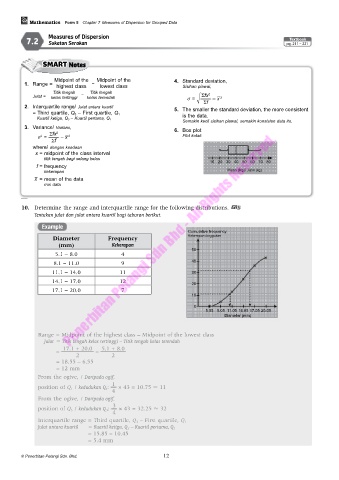
                Example
                                                                   Cumulative frequency
                    Diameter           Frequency                   Kekerapan longgokan
                      (mm)              Kekerapan
                                                                    50
                    5.1 – 8.0               4
                    8.1 – 11.0              9                       40
                   11.1 – 14.0             11                       30
                   14.1 – 17.0             12
                                                                    20
                   17.1 – 20.0              7
                                                                    10

                                                                     0
                                                                         5.05 8.05 11.05 14.05 17.05 20.05
                                                                                Diameter (mm)


               Range = Midpoint of the highest class – Midpoint of the lowest class
                Julat  = Titik tengah kelas tertinggi – Titik tengah kelas terendah
                       17.1 + 20.0   5.1 + 8.0
                     =             –
                            2           2
                     = 18.55 – 6.55
                     = 12 mm
              From the ogive, / Daripada ogif,
                                        1
              position of Q 1  / kedudukan Q 1:    × 43 = 10.75  11
                                        4
              From the ogive, / Daripada ogif,
                                         3
              position of Q 3  / kedudukan Q 3:    × 43 = 32.25  32
                                         4
              Interquartile range = Third quartile, Q 3  – First quartile, Q 1
              Julat antara kuartil   = Kuartil ketiga, Q 3  – Kuartil pertama, Q 1
                                = 15.85 – 10.45
                                = 5.4 mm


        © Penerbitan Pelangi Sdn. Bhd.                    12
   13   14   15   16   17   18   19   20   21   22   23