
Page 20 - TOP CLASS MATHS T5 KSSM
P. 20
Mathematics Form 5 Chapter 7 Measures of Dispersion for Grouped Data
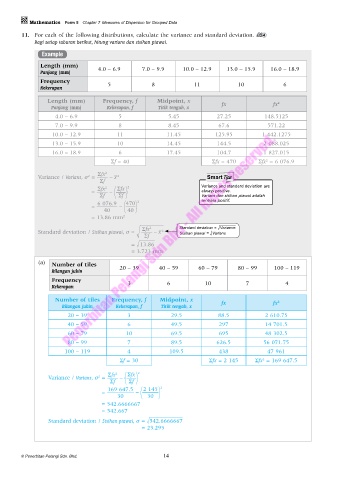
11. For each of the following distributions, calculate the variance and standard deviation. PL 4
Bagi setiap taburan berikut, hitung varians dan sisihan piawai.
Example
Length (mm) 4.0 – 6.9 7.0 – 9.9 10.0 – 12.9 13.0 – 15.9 16.0 – 18.9
Panjang (mm)
Frequency
Kekerapan 5 8 11 10 6
Length (mm) Frequency, f Midpoint, x fx fx 2
Panjang (mm) Kekerapan, f Titik tengah, x
4.0 – 6.9 5 5.45 27.25 148.5125
7.0 – 9.9 8 8.45 67.6 571.22
10.0 – 12.9 11 11.45 125.95 1 442.1275
13.0 – 15.9 10 14.45 144.5 2 088.025
16.0 – 18.9 6 17.45 104.7 1 827.015
Σf = 40 Σfx = 470 Σfx = 6 076.9
2
Σfx 2
Variance / Varians, σ = – x
2
–2
Σf
Σfx 2 Σfx 2 Variance and standard deviation are
= – always positive.
Σf Σf Varians dan sisihan piawai adalah
6 076.9 470 2 sentiasa positif.
= –
40 40
= 13.86 mm 2
ariance
V
Σfx
2
Standard deviation / Sisihan piawai, σ = Standard deviation =
–2
– x
Sisihan piawai = Varians
Σf
=
13.86
= 3.723 mm
(a) Number of tiles
Bilangan jubin 20 – 39 40 – 59 60 – 79 80 – 99 100 – 119
Frequency 3 6 10 7 4
Kekerapan
Number of tiles Frequency, f Midpoint, x 2
Bilangan jubin Kekerapan, f Titik tengah, x fx fx
20 – 39 3 29.5 88.5 2 610.75
40 – 59 6 49.5 297 14 701.5
60 – 79 10 69.5 695 48 302.5
80 – 99 7 89.5 626.5 56 071.75
100 – 119 4 109.5 438 47 961
Σf = 30 Σfx = 2 145 Σfx = 169 647.5
2
Σfx 2 Σfx 2
2
Variance / Varians, σ = –
Σf Σf
169 647.5 2 145 2
= –
30 30
= 542.6666667
= 542.667
Standard deviation / Sisihan piawai, σ = 542.6666667
= 23.295
© Penerbitan Pelangi Sdn. Bhd. 14