
Page 22 - TOP CLASS MATHS T5 KSSM
P. 22
Mathematics Form 5 Chapter 7 Measures of Dispersion for Grouped Data
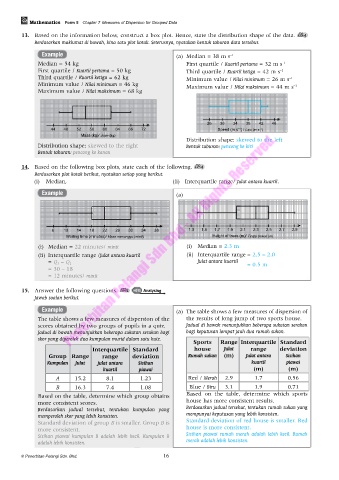
13. Based on the information below, construct a box plot. Hence, state the distribution shape of the data. PL 4
Berdasarkan maklumat di bawah, bina satu plot kotak. Seterusnya, nyatakan bentuk taburan data tersebut.
Example (a) Median = 38 m s –1
Median = 54 kg First quartile / Kuartil pertama = 32 m s –1
First quartile / Kuartil pertama = 50 kg Third quartile / Kuartil ketiga = 42 m s –1
Third quartile / Kuartil ketiga = 62 kg Minimum value / Nilai minimum = 26 m s –1
Minimum value / Nilai minimum = 46 kg Maximum value / Nilai maksimum = 44 m s –1
Maximum value / Nilai maksimum = 68 kg
26 30 34 38 42 46
44 48 52 56 60 64 68 72 Speed (m s ) / Laju (m s –1 )
–1
Mass (kg)/ Jisim (kg)
Distribution shape: skewed to the left
Distribution shape: skewed to the right Bentuk taburan: pencong ke kiri
Bentuk taburan: pencong ke kanan
14. Based on the following box plots, state each of the following. PL 4
Berdasarkan plot kotak berikut, nyatakan setiap yang berikut.
(i) Median, (ii) Interquartile range/ Julat antara kuartil.
Example (a)
6 10 14 18 22 26 30 34 38 1.3 1.5 1.7 1.9 2.1 2.3 2.5 2.7 2.9
Waiting time (minutes)/ Masa menunggu (minit) Height of trees (m)/ Tinggi pokok (m)
(i) Median = 22 minutes/ minit (i) Median = 2.3 m
(ii) Interquartile range /Julat antara kuartil (ii) Interquartile range = 2.5 – 2.0
= Q 3 – Q 1 Julat antara kuartil = 0.5 m
= 30 – 18
= 12 minutes/ minit
15. Answer the following questions. PL 5 HOTS Analysing
Jawab soalan berikut.
Example (a) The table shows a few measures of dispersion of
The table shows a few measures of dispersion of the the results of long jump of two sports house.
scores obtained by two groups of pupils in a quiz. Jadual di bawah menunjukkan beberapa sukatan serakan
Jadual di bawah menunjukkan beberapa sukatan serakan bagi bagi keputusan lompat jauh dua rumah sukan.
skor yang diperoleh dua kumpulan murid dalam satu kuiz.
Sports Range Interquartile Standard
Interquartile Standard house Julat range deviation
Group Range range deviation Rumah sukan (m) Julat antara Sisihan
Kumpulan Julat Julat antara Sisihan kuartil piawai
kuartil piawai (m) (m)
A 15.2 8.1 1.23 Red / Merah 2.9 1.7 0.56
B 16.3 7.4 1.08 Blue / Biru 3.1 1.9 0.71
Based on the table, determine which group obtains Based on the table, determine which sports
more consistent scores. house has more consistent results.
Berdasarkan jadual tersebut, tentukan kumpulan yang Berdasarkan jadual tersebut, tentukan rumah sukan yang
memperoleh skor yang lebih konsisten. mempunyai keputusan yang lebih konsisten.
Standard deviation of group B is smaller. Group B is Standard deviation of red house is smaller. Red
more consistent. house is more consistent.
Sisihan piawai kumpulan B adalah lebih kecil. Kumpulan B Sisihan piawai rumah merah adalah lebih kecil. Rumah
adalah lebih konsisten. merah adalah lebih konsisten.
© Penerbitan Pelangi Sdn. Bhd. 16