
Page 24 - TOP CLASS MATHS T5 KSSM
P. 24
Mathematics Form 5 Chapter 7 Measures of Dispersion for Grouped Data
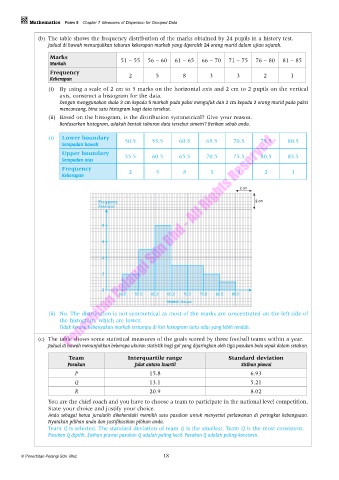
(b) The table shows the frequency distribution of the marks obtained by 24 pupils in a history test.
Jadual di bawah menunjukkan taburan kekerapan markah yang diperoleh 24 orang murid dalam ujian sejarah.
Marks 51 – 55 56 – 60 61 – 65 66 – 70 71 – 75 76 – 80 81 – 85
Markah
Frequency 2 5 8 3 3 2 1
Kekerapan
(i) By using a scale of 2 cm to 5 marks on the horizontal axis and 2 cm to 2 pupils on the vertical
axis, construct a histogram for the data.
Dengan menggunakan skala 2 cm kepada 5 markah pada paksi mengufuk dan 2 cm kepada 2 orang murid pada paksi
mencancang, bina satu histogram bagi data tersebut.
(ii) Based on the histogram, is the distribution symmetrical? Give your reason.
Berdasarkan histogram, adakah bentuk taburan data tersebut simetri? Berikan sebab anda.
(i) Lower boundary
Sempadan bawah 50.5 55.5 60.5 65.5 70.5 75.5 80.5
Upper boundary 55.5 60.5 65.5 70.5 75.5 80.5 85.5
Sempadan atas
Frequency 2 5 8 3 3 2 1
Kekerapan
2 cm
Frequency 2 cm
Kekerapan
8
6
4
2
0
50.5 55.5 60.5 65.5 70.5 75.5 80.5 85.5
Marks/ Markah
(ii) No. The distribution is not symmetrical as most of the marks are concentrated on the left side of
the histogram, which are lower.
Tidak kerana kebanyakan markah tertumpu di kiri histogram iaitu nilai yang lebih rendah.
(c) The table shows some statistical measures of the goals scored by three football teams within a year.
Jadual di bawah menunjukkan beberapa ukuran statistik bagi gol yang dijaringkan oleh tiga pasukan bola sepak dalam setahun.
Team Interquartile range Standard deviation
Pasukan Julat antara kuartil Sisihan piawai
P 15.8 6.93
Q 13.1 5.21
R 20.9 8.02
You are the chief coach and you have to choose a team to participate in the national level competition.
State your choice and justify your choice.
Anda sebagai ketua jurulatih dikehendaki memilih satu pasukan untuk menyertai perlawanan di peringkat kebangsaan.
Nyatakan pilihan anda dan justifikasikan pilihan anda.
Team Q is selected. The standard deviation of team Q is the smallest. Team Q is the most consistent.
Pasukan Q dipilih. Sisihan piawai pasukan Q adalah paling kecil. Pasukan Q adalah paling konsisten.
© Penerbitan Pelangi Sdn. Bhd. 18