Page 45 - Hybrid PBD 2022 Form 5 - Mathematics
P. 45

Matematik Tingkatan 5  Bab 6 Nisbah dan Graf Fungsi Trigonometri

                 Kertas 2                                                              y
                                                                                     9
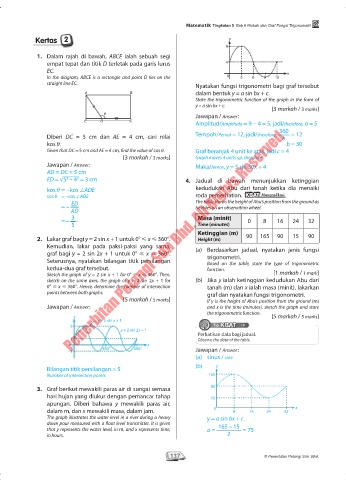
                  1.  Dalam rajah di bawah,  ABCE ialah sebuah segi
                     empat tepat dan titik D terletak pada garis lurus               4
                     EC.                                                                                    x
                     In the diagram, ABCE is a rectangle and point D lies on the      0    3   6   9   12
                     straight line EC.                                    Nyatakan fungsi trigonometri bagi graf tersebut
                                  A                B                      dalam bentuk y = a sin bx + c.
                                                                          State the trigonometric function of the graph in the form of
                                                                          y = a sin bx + c.
                                                                                                      [3 markah / 3 marks]
                                         θ                                Jawapan / Answer :
                                  E     D          C
                                                                          Amplitud/Amplitude = 9 − 4 = 5, jadi/therefore, a = 5
                            –1Penerbitan Pelangi Sdn Bhd. All Rights Reserved
                                                                                                         360
                     Diberi  DC = 5 cm dan  AE = 4 cm, cari nilai         Tempoh/Period = 12, jadi/therefore,   b   = 12
                     kos q.                                                                                b = 30
                     Given that DC = 5 cm and AE = 4 cm, find the value of cos q.  Graf beranjak 4 unit ke atas, jadi c = 4
                                                [3 markah / 3 marks]      Graph moves 4 units up, therefore
                     Jawapan / Answer :                                   Maka/Hence, y = 5 sin 30x + 4
                     AD = DC = 5 cm
                            2
                     ED = √5  – 4  = 3 cm                               4.  Jadual  di bawah  menunjukkan ketinggian
                                2
                     kos q = −kos ∠ADE                                    kedudukan Abu dari tanah ketika dia menaiki
                     cos q  = −cos ∠ADE                                   roda pemerhatian.  KBAT  Mengaplikasi
                              ED                                          The table shows the height of Abu’s position from the ground as
                          = –                                             he rides on an observation wheel.
                             AD
                              3                                            Masa (minit)
                          = –                                                                0     8    16    24   32
                              5                                            Time (minutes)
                                                                           Ketinggian (m)    90   165   90    15   90
                  2.  Lakar graf bagi y = 2 sin x + 1 untuk 0° < x < 360°.   Height (m)
                     Kemudian, lakar pada paksi-paksi yang sama,          (a)  Berdasarkan jadual, nyatakan jenis fungsi
                     graf bagi y = 2 sin 2x + 1 untuk 0° < x < 360°.           trigonometri.
                     Seterusnya, nyatakan bilangan titik persilangan           Based on  the table, state  the type  of trigonometric
                     kedua-dua graf tersebut.                                  function.
                     Sketch the graph of y = 2 sin x + 1 for 0° < x < 360°. Then,                      [1 markah / 1 mark]
                     sketch on the same axes, the graph of y = 2 sin 2x  + 1 for     (b)  Jika y ialah ketinggian kedudukan Abu dari
                     0° < x < 360°. Hence, determine the number of intersection   tanah (m) dan x ialah masa (minit), lakarkan
                     points between both graphs.                               graf dan nyatakan fungsi trigonometri.
                                                [5 markah / 5 marks]           If y is the height of Abu’s position from the ground (m)
                     Jawapan / Answer :                                        and x is the time (minutes), sketch the graph and state
                                                                               the trigonometric function.
                              y                                                                       [5 markah / 5 marks]
                                       y = 2 sin x + 1
                                                                                    KBAT
                             3                                                   Tip KBATKBAT
                                               y = 2 sin 2x + 1
                                                                           Perhatikan data bagi jadual.
                             1                                             Observe the data of the table.
                                                         x
                              0          180°       360°                  Jawapan / Answer :
                                                                          (a)  sinus / sine
                     Bilangan titik persilangan = 5                       (b)     y
                     Number of intersection points                             165

                  3.  Graf berikut mewakili paras air di sungai semasa          90
                     hari hujan yang diukur dengan pemancar tahap               15
                     apungan. Diberi bahawa  y mewakili paras air,
                     dalam m, dan x mewakili masa, dalam jam.                    0      8     16    24    32   x
                     The graph illustrates the water level in a river during a heavy      y = a sin bx + c
                     down pour measured with a float level transmitter. It is given
                     that y represents the water level, in m, and x represents time,      a =   165 – 15   = 75
                     in hours.                                                        2


                                                                 137                               © Penerbitan Pelangi Sdn. Bhd.


         06 Hybrid PBD Mate Tg5.indd   137                                                                        28/09/2021   5:15 PM
   40   41   42   43   44   45   46   47   48