Page 12 - Ranger SPM 2022 - Additional Mathematics
P. 12

Additional Mathematics  SPM  Chapter  2 Quadratic Functions

                      2.3    Quadratic Functions
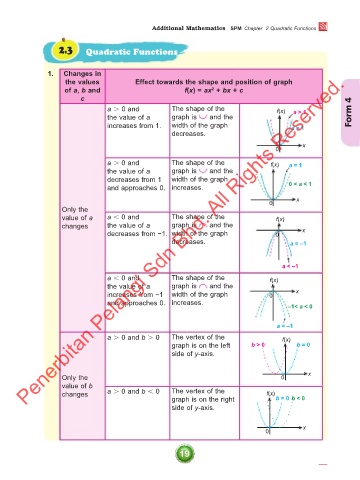


                    1.  Changes in
                        the values         Effect towards the shape and position of graph
                       of a, b and                      f(x) = ax  + bx + c
                                                                2
                            c
                                   a  0 and         The shape of the            0Reserved.
                                                                                  f(x)
                                                                                      a > 1
                                   the value of a    graph is    and the                              Form 4
                                   increases from 1.  width of the graph              a = 1
                                                     decreases.                          x
             Penerbitan Pelangi Sdn Bhd. All Rights

                                   a  0 and         The shape of the           f(x)  a = 1
                                   the value of a    graph is    and the
                                   decreases from 1   width of the graph
                                   and approaches 0. increases.                      0 < a < 1
                                                                                       x
                                                                                0
                       Only the
                       value of a   a  0 and        The shape of the            f(x)
                       changes     the value of a    graph is    and the
                                   decreases from −1. width of the graph         0       x
                                                     decreases.                      a = –1


                                                                                   a < –1
                                   a  0 and         The shape of the           f(x)
                                   the value of a    graph is    and the
                                   increases from −1  width of the graph        0      x
                                   and approaches 0. increases.
                                                                                     –1< a < 0

                                                                                  a = –1
                                   a  0 and b  0   The vertex of the             f(x)
                                                     graph is on the left   b > 0      b = 0
                                                     side of y-axis.


                       Only the                                                    0      x
                       value of b
                       changes     a  0 and b  0   The vertex of the         f(x)
                                                     graph is on the right       b = 0 b < 0
                                                     side of y-axis.

                                                                                         x
                                                                               0


                                                       19


         02 Ranger Add Mathematics Tg4.indd   19                                            25/02/2022   9:10 AM
   7   8   9   10   11   12   13   14   15   16   17