Page 22 - Arebian
P. 22

22


                                Total                                                 Excess      Excess
                  Month      Production      KWH            SEC       %Deviation   Energy WRT      Cost
                               in MT      Consumption    (KWH/MT)      from Best     Best SEC     Spent
                January          1065.2        436417         409.70       16.77         73205     27818
                February         1131.4        385784         340.98        0.00              0        0
                March              1079        424791         393.69       13.39         56874     21612
                April              1096        450168         410.74       16.98         76454     29052
                May                 985        453284         460.19       25.90        117419     44619
                June                980        521834         532.48       35.96        187674     71316
                July               1100        536018         487.29       30.03        160940     61157
                August             1052        563384         535.54       36.33        204673     77776
                September          1126        557618         495.22       31.15        173675     65996
                October            1159        541051         466.83       26.96        145855     55425
                November           1233        541051         438.81       22.29        120623     45837
                December           1314        462751         352.17        3.18         14703      5587
                TOTAL         13320.6     489512.5833                 Total            1332094    506196

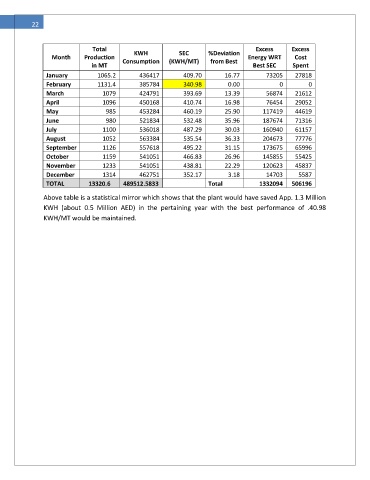
               Above table is a statistical mirror which shows that the plant would have saved App. 1.3 Million
               KWH  (about  0.5  Million  AED)  in  the  pertaining  year  with  the  best  performance  of  .40.98
               KWH/MT would be maintained.
   17   18   19   20   21   22   23   24   25   26   27