
Page 21 - Arebian
P. 21
21
Table 4
Total Production KWH
Month SEC(KWH/QTY)
in MT Consumption
January 1065.2 436417 409.7042809
February 1131.4 385784 340.9793177
March 1079 424791 393.6895273
April 1096 450168 410.7372263
May 985 453284 460.186802
June 980 521834 532.4836735
July 1100 536018 487.2890909
August 1052 563384 535.5361217
September 1126 557618 495.2202487
October 1159 541051 466.8257118
November 1233 541051 438.8085969
December 1314 462751 352.1697108
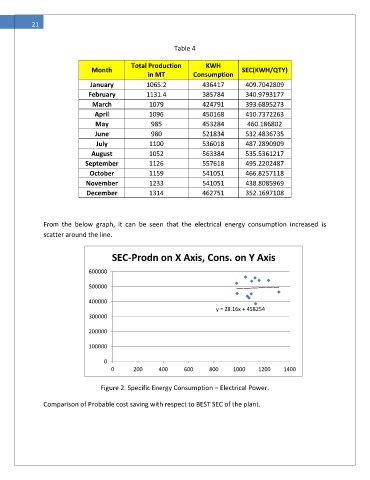
From the below graph, it can be seen that the electrical energy consumption increased is
scatter around the line.
SEC-Prodn on X Axis, Cons. on Y Axis
600000
500000
400000
y = 28.16x + 458254
300000
200000
100000
0
0 200 400 600 800 1000 1200 1400
Figure 2. Specific Energy Consumption – Electrical Power.
Comparison of Probable cost saving with respect to BEST SEC of the plant.