Page 128 - The Effect of Hydrogen and Hydrides - ebook first test
P. 128

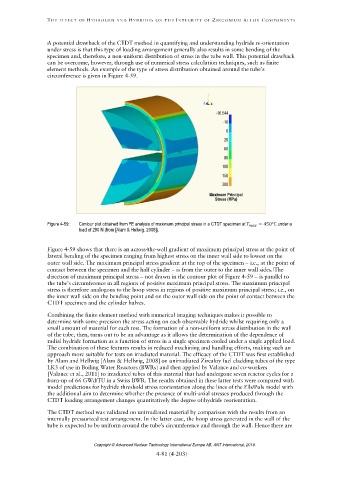
Figure 4-59:   Contour plot obtained from FE analysis of maximum principal stress in a CTDT specimen at           = 450°C under a
                             load of 290 N (from [Alam & Hellwig, 2008]).


                                                                                         
                                                               
                                                                                           


                                   Copyright © Advanced Nuclear Technology International Europe AB, ANT International, 2019.
   123   124   125   126   127   128   129   130   131   132   133