
Page 129 - The Effect of Hydrogen and Hydrides - ebook first test
P. 129
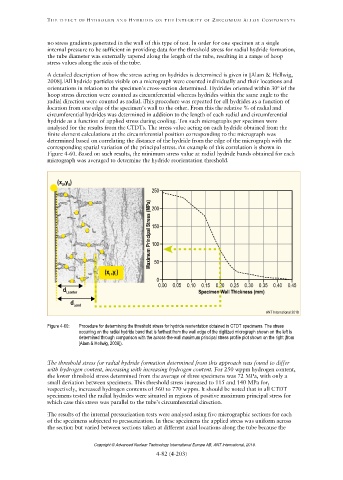
Figure 4-60: Procedure for determining the threshold stress for hydride reorientation obtained in CTDT specimens. The stress
occurring on the radial hydride band that is farthest from the wall edge of the digitized micrograph shown on the left is
determined through comparison with the across-the-wall maximum principal stress profile plot shown on the right (from
[Alam & Hellwig, 2008]).
Copyright © Advanced Nuclear Technology International Europe AB, ANT International, 2019.