
Page 160 - The Effect of Hydrogen and Hydrides - ebook first test
P. 160
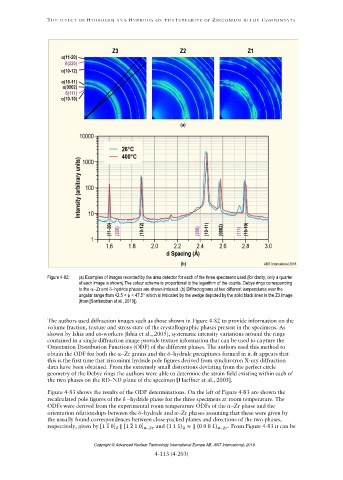
Figure 4-82: (a) Examples of images recorded by the area detector for each of the three specimens used (for clarity, only a quarter
of each image is shown).The colour scheme is proportional to the logarithm of the counts. Debye rings corresponding
to the Zr and δhydride phases are shown indexed. (b) Diffractograms at two different temperatures over the
angular range from 42.5 < ϕ < 47.5 which is indicated by the wedge depicted by the solid black lines in the Z3 image
(from [Santisteban et al., 2010]).
̅
̅
[1 1 0] ‖ [1 2 1 0] − (1 1 1) ≈ ‖ (0 0 0 1) −
Copyright © Advanced Nuclear Technology International Europe AB, ANT International, 2019.