
Page 170 - The Effect of Hydrogen and Hydrides - ebook first test
P. 170
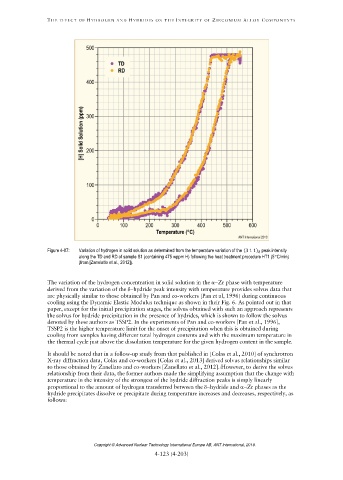
Figure 4-87: Variation of hydrogen in solid solution as determined from the temperature variation of the (3 1 1) peak intensity
δ
along the TD and RD of sample S1 (containing 475 wppm H) following the heat treatment procedure HT1 (5C/min)
(from [Zanelatto et al., 2012]).
Copyright © Advanced Nuclear Technology International Europe AB, ANT International, 2019.