
Page 172 - The Effect of Hydrogen and Hydrides - ebook first test
P. 172
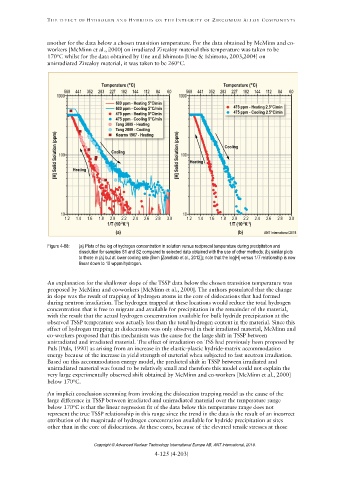
Figure 4-88: (a) Plots of the log of hydrogen concentration in solution versus reciprocal temperature during precipitation and
dissolution for samples S1 and S2 compared to selected data obtained with the use of other methods; (b) similar plots
to those in (a) but at lower cooling rate (from [Zanellato et al., 2012]); note that the log[H] versus 1/T relationship is now
linear down to 10 wppm hydrogen.
Copyright © Advanced Nuclear Technology International Europe AB, ANT International, 2019.