
Page 175 - The Effect of Hydrogen and Hydrides - ebook first test
P. 175
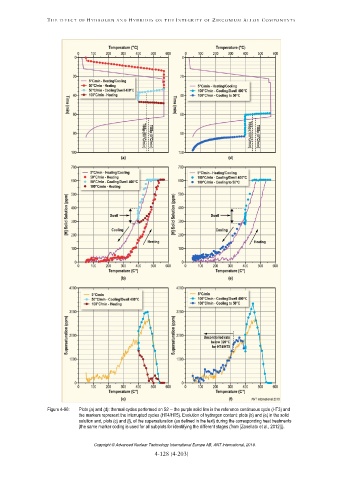
Figure 4-90: Plots (a) and (d): thermal cycles performed on S2 the purple solid line is the reference continuous cycle (HT3) and
the markers represent the interrupted cycles (HT4/HT5). Evolution of hydrogen content: plots (b) and (e) in the solid
solution and, plots (c) and (f), of the supersaturation (as defined in the text) during the corresponding heat treatments
(the same marker coding is used for all subplots for identifying the different stages (from [Zanellato et al., 2012])).
Copyright © Advanced Nuclear Technology International Europe AB, ANT International, 2019.