
Page 174 - The Effect of Hydrogen and Hydrides - ebook first test
P. 174
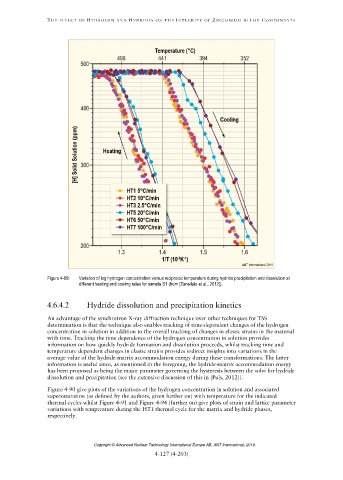
Figure 4-89:   Variation of log hydrogen concentration versus reciprocal temperature during hydride precipitation and dissolution at
                             different heating and cooling rates for sample S1 (from [Zanellato et al., 2012]).


                  4.6.4.2


                                   Copyright © Advanced Nuclear Technology International Europe AB, ANT International, 2019.