
Page 1173 - How to Make Money in Stocks Trilogy
P. 1173
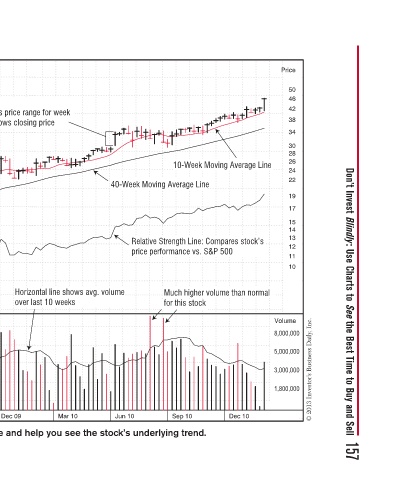
Don’t Invest Blindly: Use Charts to See the Best Time to Buy and Sell 157


             Price  50  46  42  38  34  30  28  26  24  22  19  17  15  14  13  12  11  10  Volume  8,000,000  5,000,000  3,000,000  1,800,000  © 2013 Investor’s Business Daily, Inc.

                             10-Week Moving Average Line   Relative Strength Line: Compares stock’s   Much higher volume than normal  Dec 10


                                40-Week Moving Average Line   price performance vs. S&P 500   for this stock  Sep 10  Jun 10


                    - Vertical bar shows price range for week - Horizontal line shows closing price   Horizontal line shows avg. volume  over last 10 weeks  Mar 10  Dec 09 Weekly charts give you a longer term perspective and help you see the stock’s underlying trend.


                                                   Volume (number of shares traded)  Jun 09
                  Price:                                              Sep 09


              How to Read WEEKLY Charts  PRICE AREA  Black Bar*    Up Week    Down Week Red Bar     *Up weeks in blue in IBD Charts on Investors.com  VOLUME AREA  Mar 09  Dec 08  Sep 08