
Page 1175 - How to Make Money in Stocks Trilogy
P. 1175
158 HOW TO MAKE MONEY IN STOCKS—GETTING STARTED
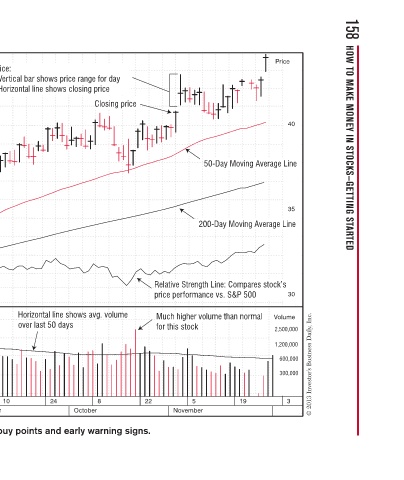
50-Day Moving Average Line 200-Day Moving Average Line Relative Strength Line: Compares stock’s price performance vs. S&P 500 Much higher volume than normal 19
40 35 30 600,000 300,000 3 © 2013 Investor’s Business Daily, Inc.
Price Volume 2,500,000 1,200,000
for this stock
22 5 November
Closing price
- Vertical bar shows price range for day - Horizontal line shows closing price Horizontal line shows avg. volume over last 50 days 8 24 October
Price: 10 September Daily charts help you spot specific buy points and early warning signs.
Volume (number of shares traded) 27 13
August
30
How to Read DAILY Charts PRICE AREA Black Bar* Up Day Down Day Red Bar *Up days in blue in IBD Charts on Investors.com VOLUME AREA 16 2 18 July