
Page 1174 - How to Make Money in Stocks Trilogy
P. 1174
158
HOW TO MAKE MONEY IN STOCKS—GETTING STARTED
50-Day Moving Average Line
200-Day Moving Average Line
40
30
35
Price
Relative Strength Line: Compares stock’s
price performance vs. S&P 500
Closing price
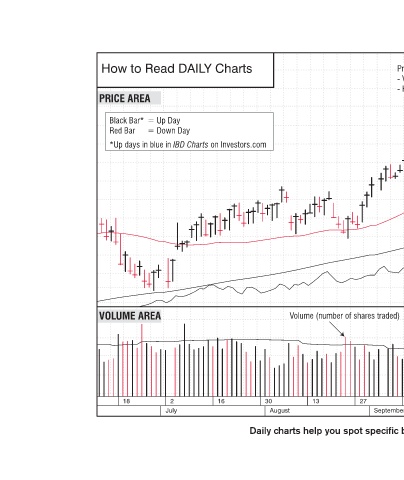
- Vertical bar shows price range for day
- Horizontal line shows closing price
Price:
Volume (number of shares traded) Horizontal line shows avg. volume Volume Much higher volume than normal over last 50 days for this stock 2,500,000 1,200,000 600,000 300,000 3 19 5 22 8 24 10 27 13 November October September © 2013 Investor’s
August
30
How to Read DAILY Charts PRICE AREA Black Bar* Up Day Down Day Red Bar *Up days in blue in IBD Charts on Investors.com VOLUME AREA 16 2 18 July