Page 1182 - How to Make Money in Stocks Trilogy
P. 1182

Don’t Invest Blindly: Use Charts to See the Best Time to Buy and Sell 165


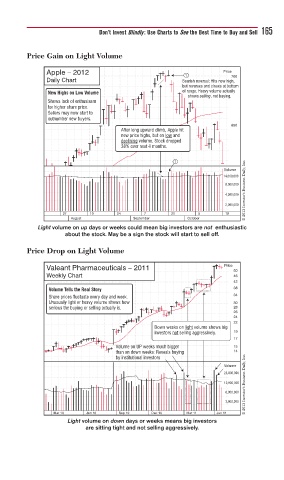
         Price Gain on Light Volume

              Apple – 2012                                      Price
                                                     1            700
              Daily Chart                           Bearish reversal: Hits new high,
                                                    but reverses and closes at bottom
              New Highs on Low Volume               of range. Heavy volume actually
                                                         shows selling, not buying.
              Shows lack of enthusiasm
              for higher share price.
              Sellers may now start to
              outnumber new buyers.
                                                                  650
                                   After long upward climb, Apple hit
                                   new price highs, but on low and
                                   declining volume. Stock dropped
                                   38% over next 4 months.
                                                                      © 2013 Investor’s Business Daily, Inc.
                                                  1
                                                                Volume
                                                                14,000,000
                                                                8,000,000
                                                                4,000,000
                                                                2,000,000
                   27     10      24     7       21      5      19
                     August           September       October
            Light volume on up days or weeks could mean big investors are not enthusiastic
                   about the stock. May be a sign the stock will start to sell off.
         Price Drop on Light Volume

              Valeant Pharmaceuticals – 2011                    Price  50
              Weekly Chart                                        46
                                                                  42
               Volume Tells the Real Story                        38
               Share prices fluctuate every day and week.         34
               Unusually light or heavy volume shows how          30
               serious the buying or selling actually is.         28
                                                                  26
                                                                  24
                                                                  22
                                            Down weeks on light volume shows big
                                            investors not selling aggressively.  19
                                                                  17
                                 Volume on UP weeks much bigger   15
                                 than on down weeks: Reveals buying  14
                                                                      © 2013 Investor’s Business Daily, Inc.
                                 by institutional investors
                                                                Volume
                                                                25,000,000
                                                                12,000,000
                                                                6,000,000
                                                                3,000,000
                Mar 10   Jun 10   Sep 10   Dec 10    Mar 11   Jun 11
                    Light volume on down days or weeks means big investors
                         are sitting tight and not selling aggressively.
   1177   1178   1179   1180   1181   1182   1183   1184   1185   1186   1187