
Page 1198 - How to Make Money in Stocks Trilogy
P. 1198
Don’t Invest Blindly: Use Charts to See the Best Time to Buy and Sell 181
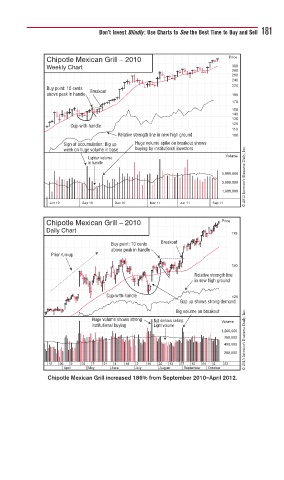
Chipotle Mexican Grill – 2010 Price
Weekly Chart 300
280
260
240
220
Buy point: 10 cents Breakout
above peak in handle 190
170
150
140
130
Cup-with-handle 120
110
Relative strength line in new high ground 100
Sign of accumulation: Big up Huge volume spike on breakout shows
© 2013 Investor’s Business Daily, Inc.
week on huge volume in base buying by institutional investors
Lighter volume Volume
in handle
5,000,000
3,000,000
1,800,000
Jun 10 Sep 10 Dec 10 Mar 11 Jun 11 Sep 11
Chipotle Mexican Grill – 2010 Price
Daily Chart
175
Buy point: 10 cents Breakout
above peak in handle
Prior run-up
150
Relative strength line
in new high ground
Cup-with-handle 125
Gap up shows strong demand
Big volume on breakout
Huge volume shows strong Not serious selling: Volume
institutional buying Light volume
1,200,000
700,000 © 2013 Investor’s Business Daily, Inc.
400,000
200,000
12 26 9 23 7 21 4 18 2 16 30 13 27 10 24 8 22
April May June July August September October
Chipotle Mexican Grill increased 186% from September 2010–April 2012.