
Page 1199 - How to Make Money in Stocks Trilogy
P. 1199
182 HOW TO MAKE MONEY IN STOCKS—GETTING STARTED
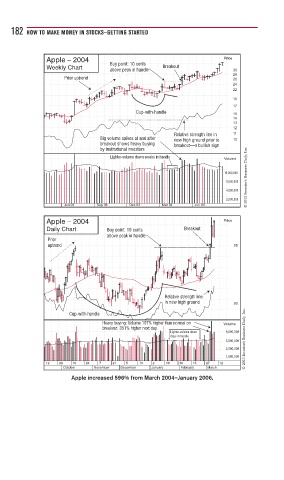
Apple – 2004 Price
Buy point: 10 cents
Weekly Chart Breakout
above peak in handle 30
28
Prior uptrend 26
24
22
19
17
Cup-with-handle 15
14
13
12
Relative strength line in 11
Big volume spikes at and after new high ground prior to 10
breakout shows heavy buying breakout—a bullish sign
© 2013 Investor’s Business Daily, Inc.
by institutional investors
Lighter-volume down weeks in handle Volume
16,000,000
8,000,000
4,000,000
2,000,000
Jun 03 Sep 03 Dec 03 Mar 04 Jun 04
Apple – 2004 Price
Daily Chart Buy point: 10 cents Breakout
above peak in handle
Prior
uptrend 25
Relative strength line
in new high ground 20
Cup-with-handle
Heavy buying: Volume 107% higher than normal on Volume
breakout. 351% higher next day.
Lighter-volume down 9,000,000
days in handle © 2013 Investor’s Business Daily, Inc.
5,000,000
3,000,000
1,800,000
12 26 10 24 7 21 5 19 2 16 30 13 27 12
October November December January February March
Apple increased 596% from March 2004–January 2006.