
Page 1203 - How to Make Money in Stocks Trilogy
P. 1203
186 HOW TO MAKE MONEY IN STOCKS—GETTING STARTED
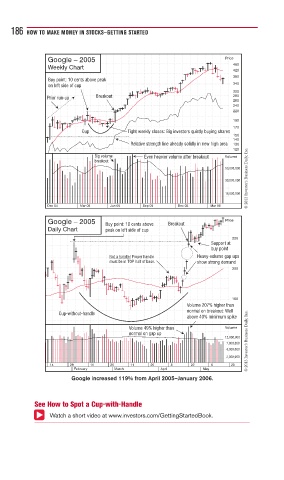
Google – 2005 Price
460
Weekly Chart
420
380
Buy point: 10 cents above peak
on left side of cup 340
300
Prior run-up Breakout 280
260
240
220
190
170
Cup Tight weekly closes: Big investors quietly buying shares
150
140
Relative strength line already solidly in new high area 130
© 2013 Investor’s Business Daily, Inc.
120
Big volume Even heavier volume after breakout Volume
breakout
50,000,000
30,000,000
16,000,000
Dec 04 Mar 05 Jun 05 Sep 05 Dec 05 Mar 06
Google – 2005 Price
Buy point: 10 cents above Breakout
Daily Chart peak on left side of cup
220
Support at
buy point
Not a handle! Proper handle Heavy-volume gap ups
must be in TOP half of base. show strong demand
200
180
Volume 207% higher than
normal on breakout: Well
Cup-without-handle
above 40% minimum spike
Volume 49% higher than Volume
normal on gap up
12,000,000 © 2013 Investor’s Business Daily, Inc.
7,000,000
4,000,000
2,000,000
14 28 11 25 11 25 8 22 6 20
February March April May
Google increased 119% from April 2005–January 2006.
See How to Spot a Cup-with-Handle
Watch a short video at www.investors.com/GettingStartedBook.