
Page 1200 - How to Make Money in Stocks Trilogy
P. 1200
Don’t Invest Blindly: Use Charts to See the Best Time to Buy and Sell 183
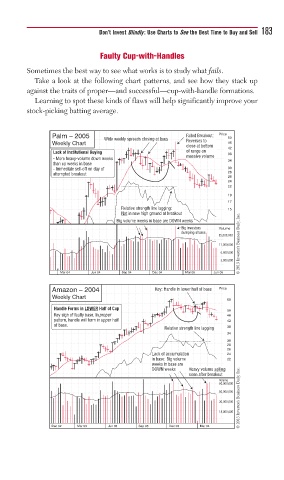
Faulty Cup-with-Handles
Sometimes the best way to see what works is to study what fails.
Take a look at the following chart patterns, and see how they stack up
against the traits of proper—and successful—cup-with-handle formations.
Learning to spot these kinds of flaws will help significantly improve your
stock-picking batting average.
Palm – 2005 Wide weekly spreads closing at lows Failed Breakout: Price 50
Weekly Chart Reverses to 46
close at bottom 42
Lack of Institutional Buying of range on
massive volume 38
- More heavy-volume down weeks
than up weeks in base 34
- Immediate sell-off on day of 30
28
attempted breakout
26
24
22
19
17
Relative strength line lagging: 15
Not in new high ground at breakout
© 2013 Investor’s Business Daily, Inc.
Big volume weeks in base are DOWN weeks
Big investors Volume
dumping shares
25,000,000
11,000,000
6,000,000
3,000,000
Mar 04 Jun 04 Sep 04 Dec 04 Mar 05 Jun 05
Amazon – 2004 Key: Handle in lower half of base Price
Weekly Chart
60
Handle Forms in LOWER Half of Cup 50
Key sign of faulty base. In proper 46
pattern, handle will form in upper half 42
of base.
Relative strength line lagging 38
34
30
28
26
Lack of accumulation 24
in base: Big volume 22
weeks in base are
© 2013 Investor’s Business Daily, Inc.
DOWN weeks Heavy volume selling
soon after breakout
Volume
80,000,000
50,000,000
30,000,000
18,000,000
Dec 02 Mar 03 Jun 03 Sep 03 Dec 03 Mar 04